
What can I ask Sense

  • How did my team perform this quarter?
  • What does my profitability look like this quarter?
  • How is my revenue trending?
  • Which jobs generated the most revenue?
  • Where are we seeing the highest costs?
Tip: Use a suggested prompt from the prompt library to get started, or ask your own question using text or voice.
The Supported Modules page lists every part of Zuper you can ask about, along with example questions for each module.

How Sense answers

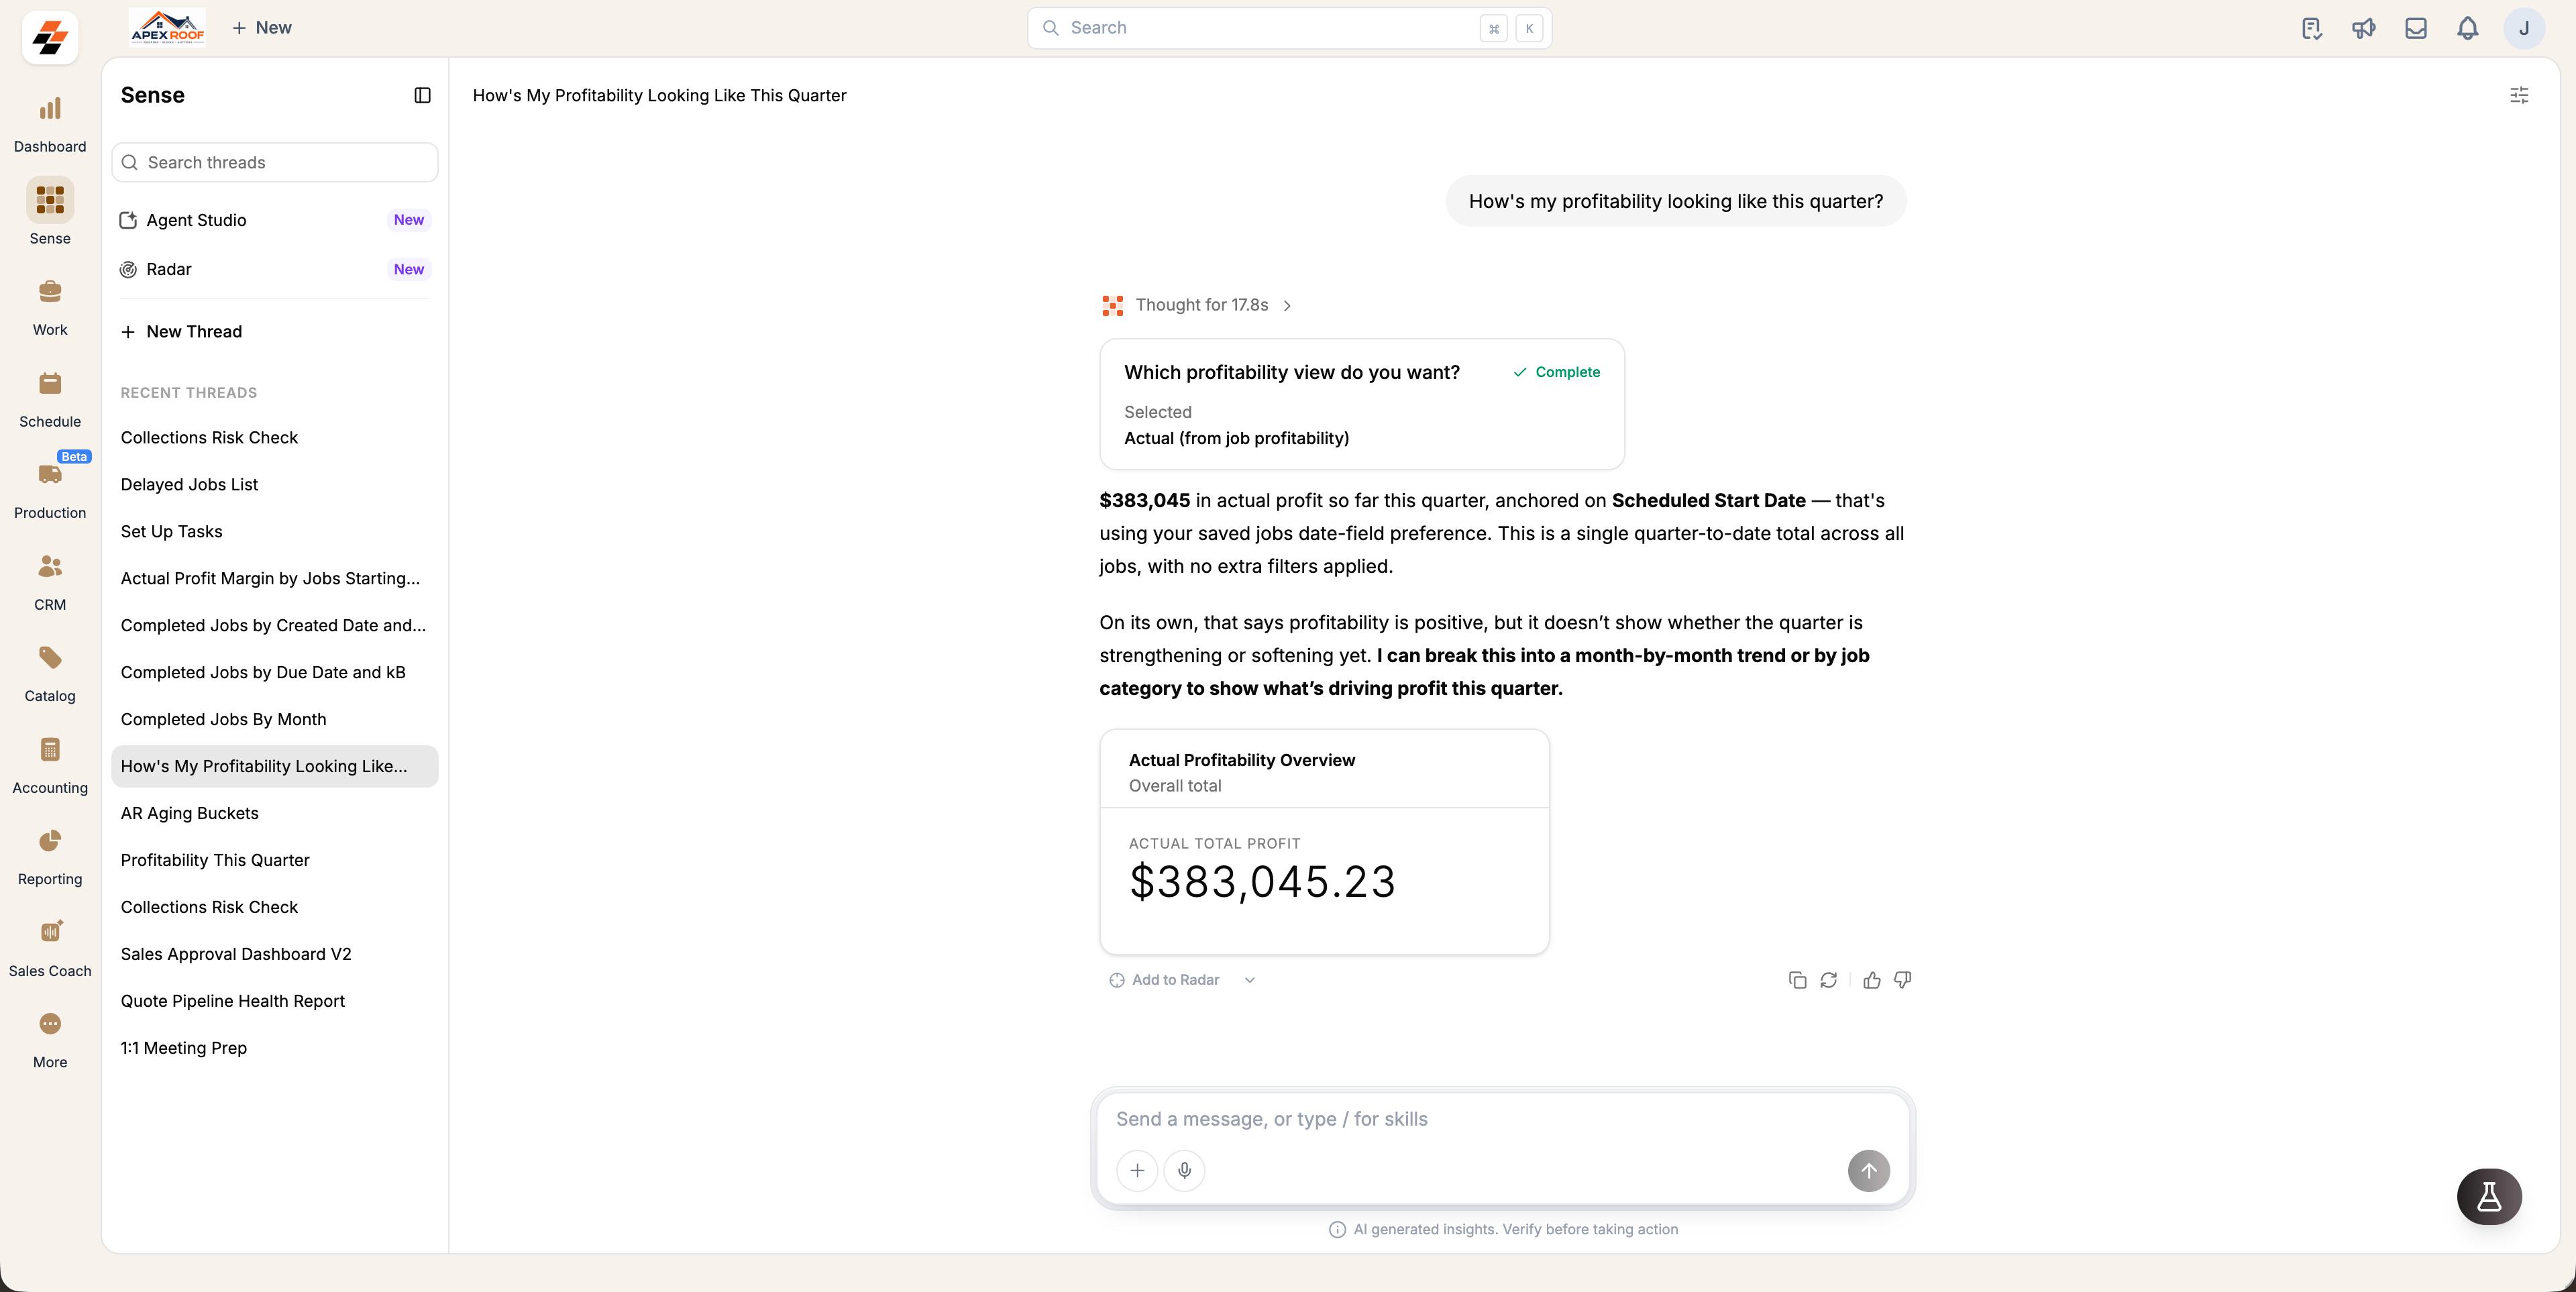
Sense reviews the relevant data in your Zuper account and automatically chooses the best format to present the answer. Depending on your question, the result may appear as a KPI, table, chart, scorecard, or written summary.
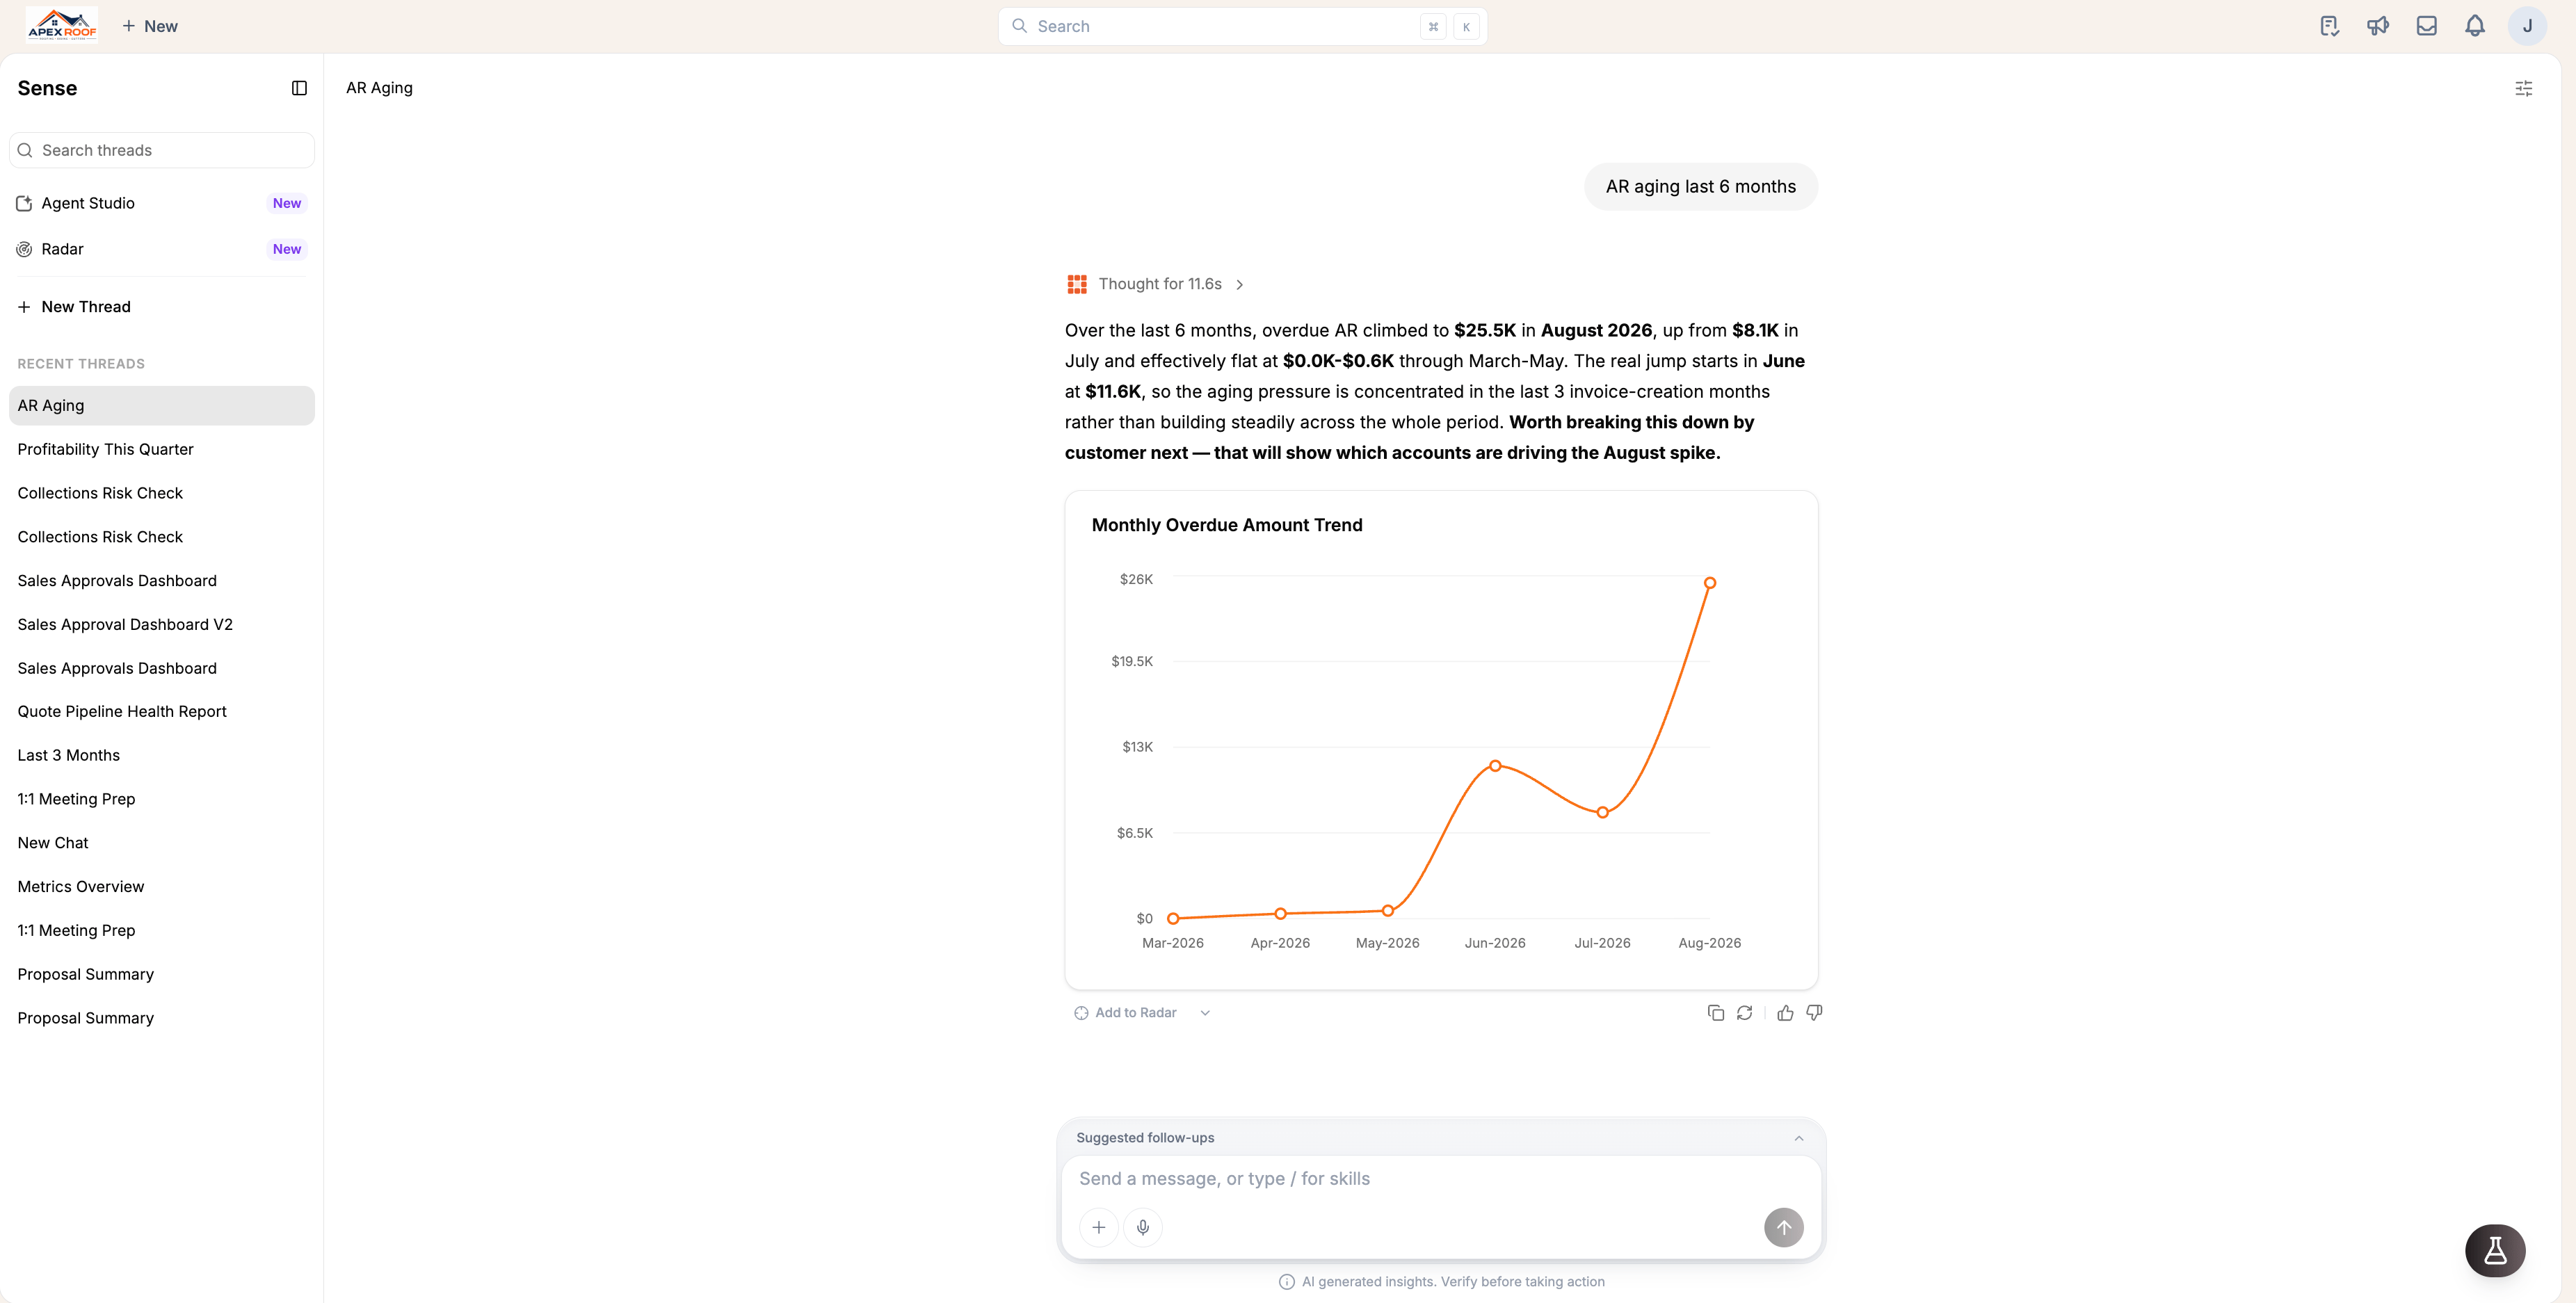
A Sense answer about AR aging, shown as a written summary above a line chart of monthly overdue amounts
Image
Every answer includes the same set of actions, such as asking follow-up questions, pinning the result to a Radar, copying the response, rerunning the query, or providing feedback. Learn more in How Answers Work.

Turn sketches into insights

You can also attach a hand-drawn sketch of the chart or KPI you’re picturing. Sense interprets the sketch and recreates it using data from your Zuper account.
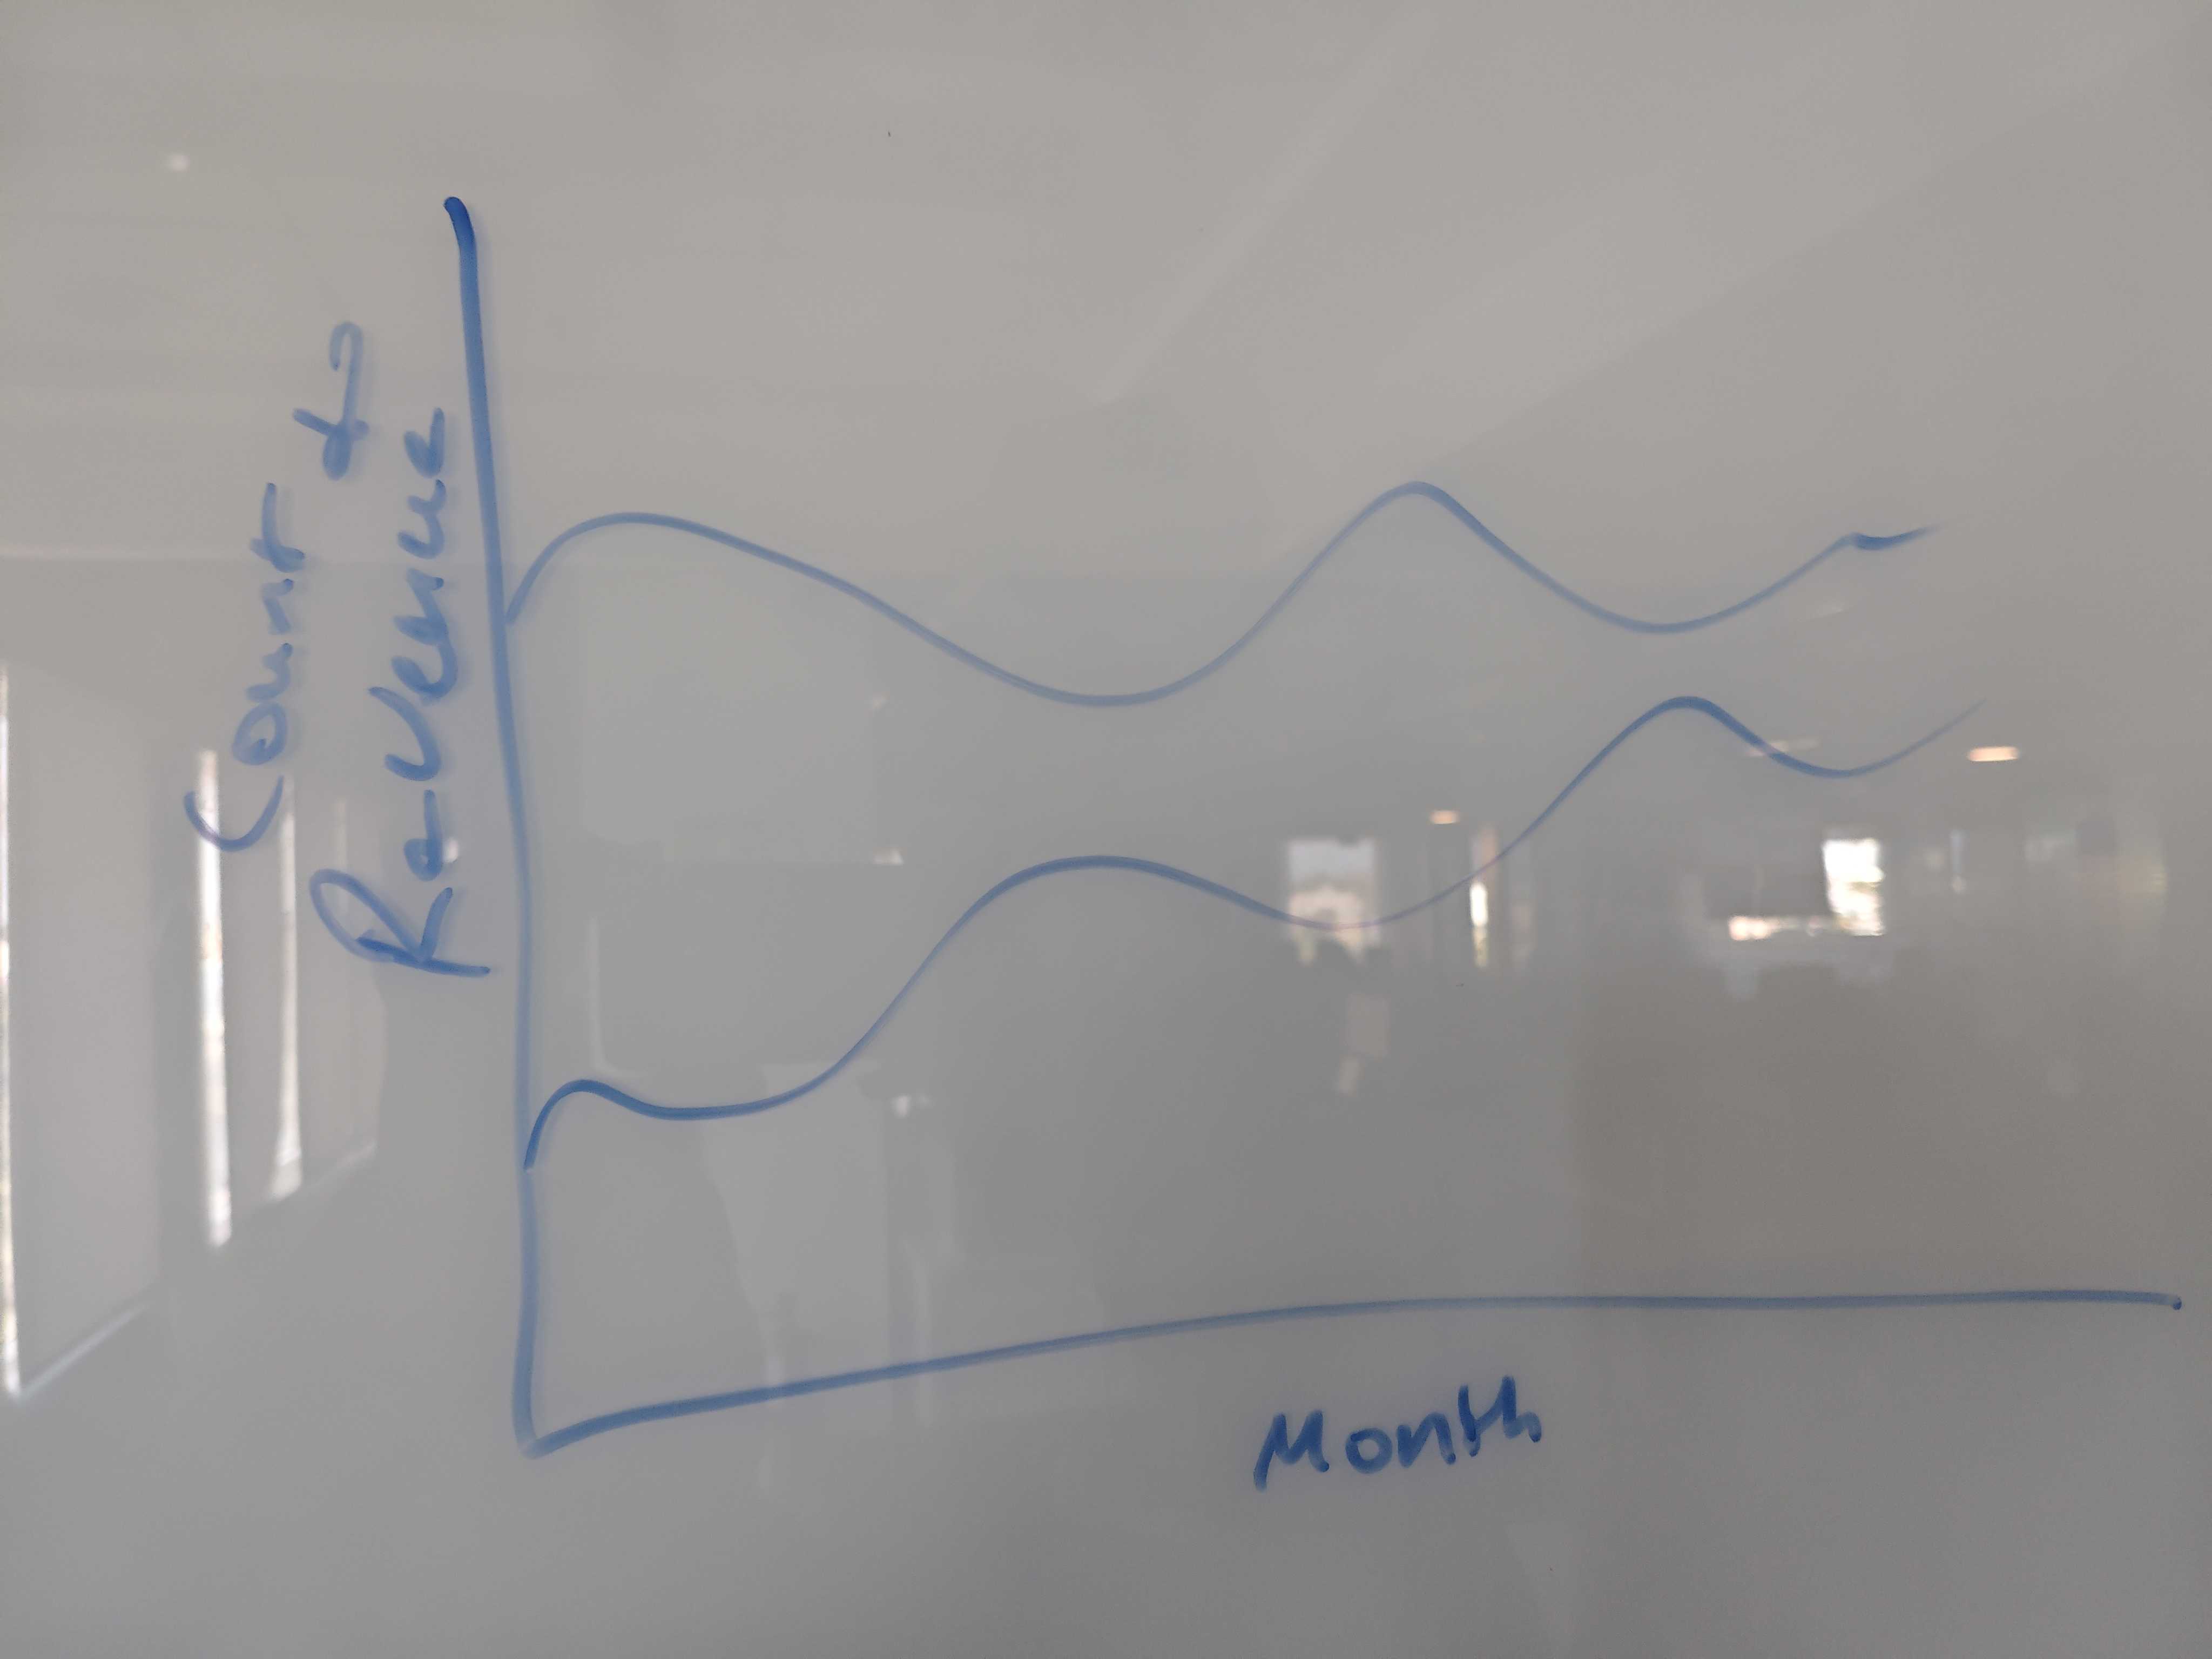
A hand-drawn sketch on a whiteboard of two lines plotted against Month, labelled Count and Revenue
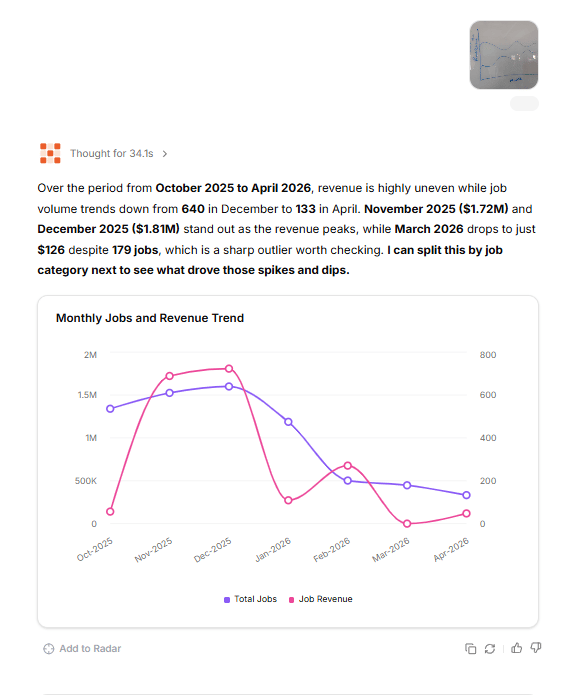
Sense analyzes the sketch and generates the requested visualization using your business data.
The answer Sense produced from the sketch: a monthly jobs and revenue trend chart with two plotted series
Tip: You can also use commands to invoke Skills directly from the chat and perform specialized actions. See Skills to learn more.