Version control overview
The Revision History records who saved what and when across both states – live and draft- giving you a clear audit trail. Use it to pinpoint whether a recent change may have introduced failures around a specific timestamp.- Live: The published, active version that runs in production. Changes take effect only after you publish and impact real executions.
- Draft: Your editable working copy for design, testing, and review. Safe to change—no impact on production until you publish.
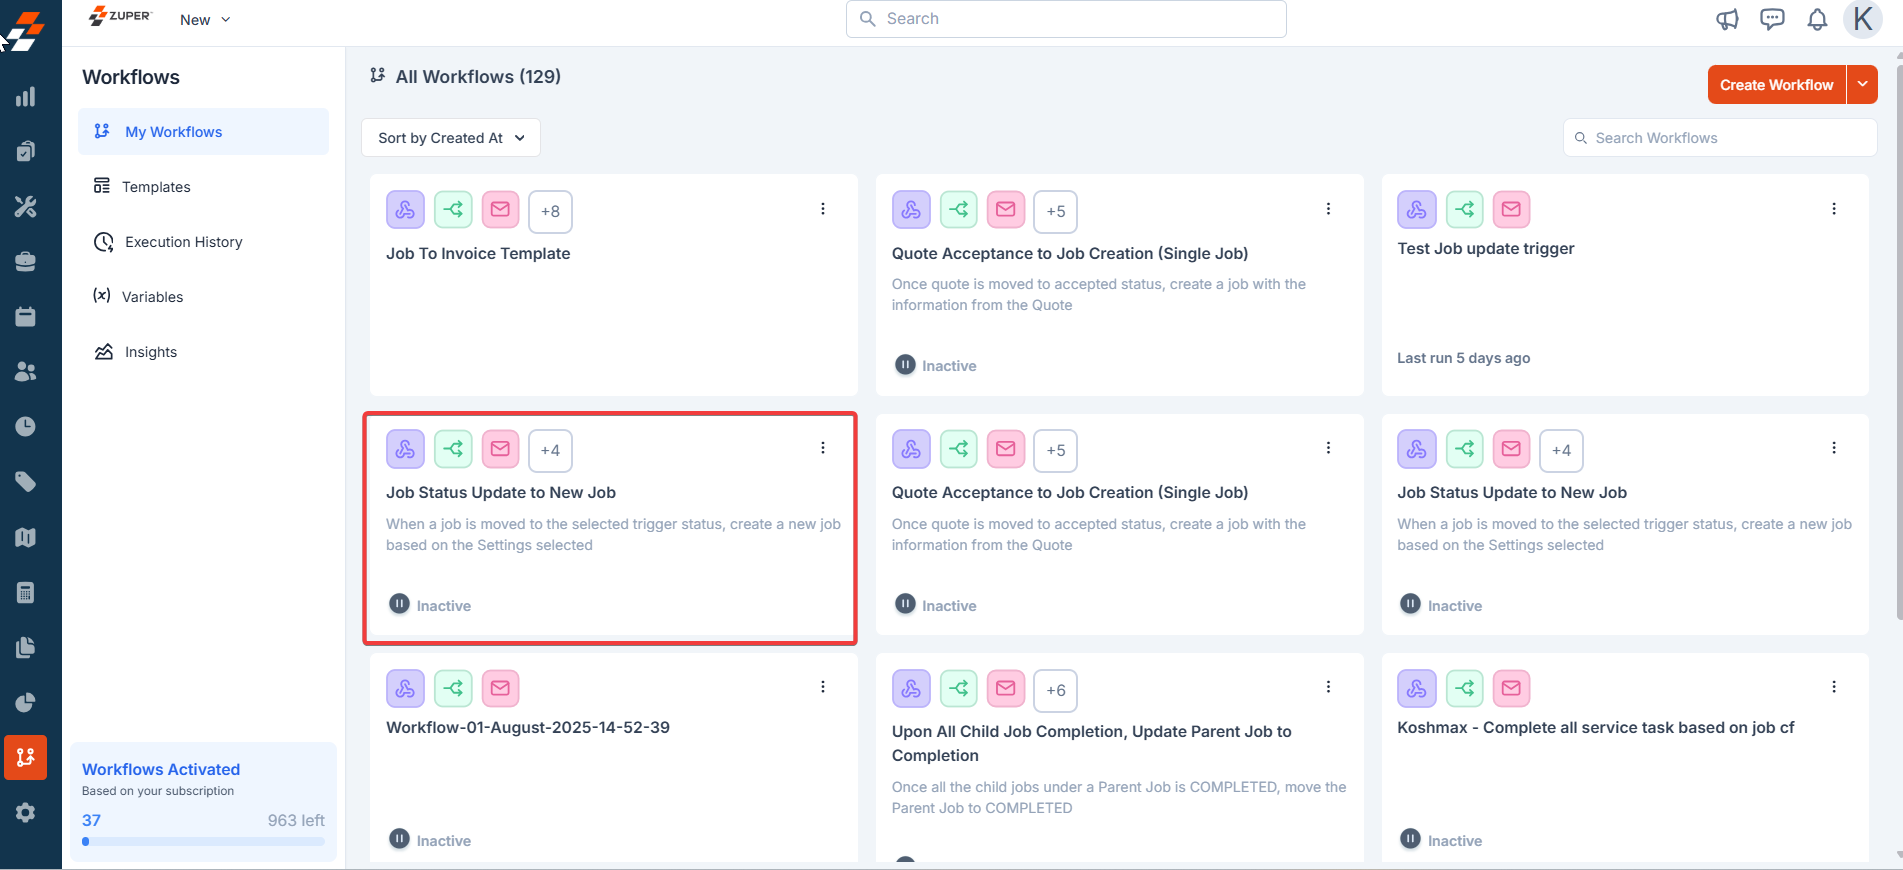
- Select any of the workflows to view the workflow in detail.
- From My Workflows, open the workflow and click the three-dot menu. Select the “Revision History.”
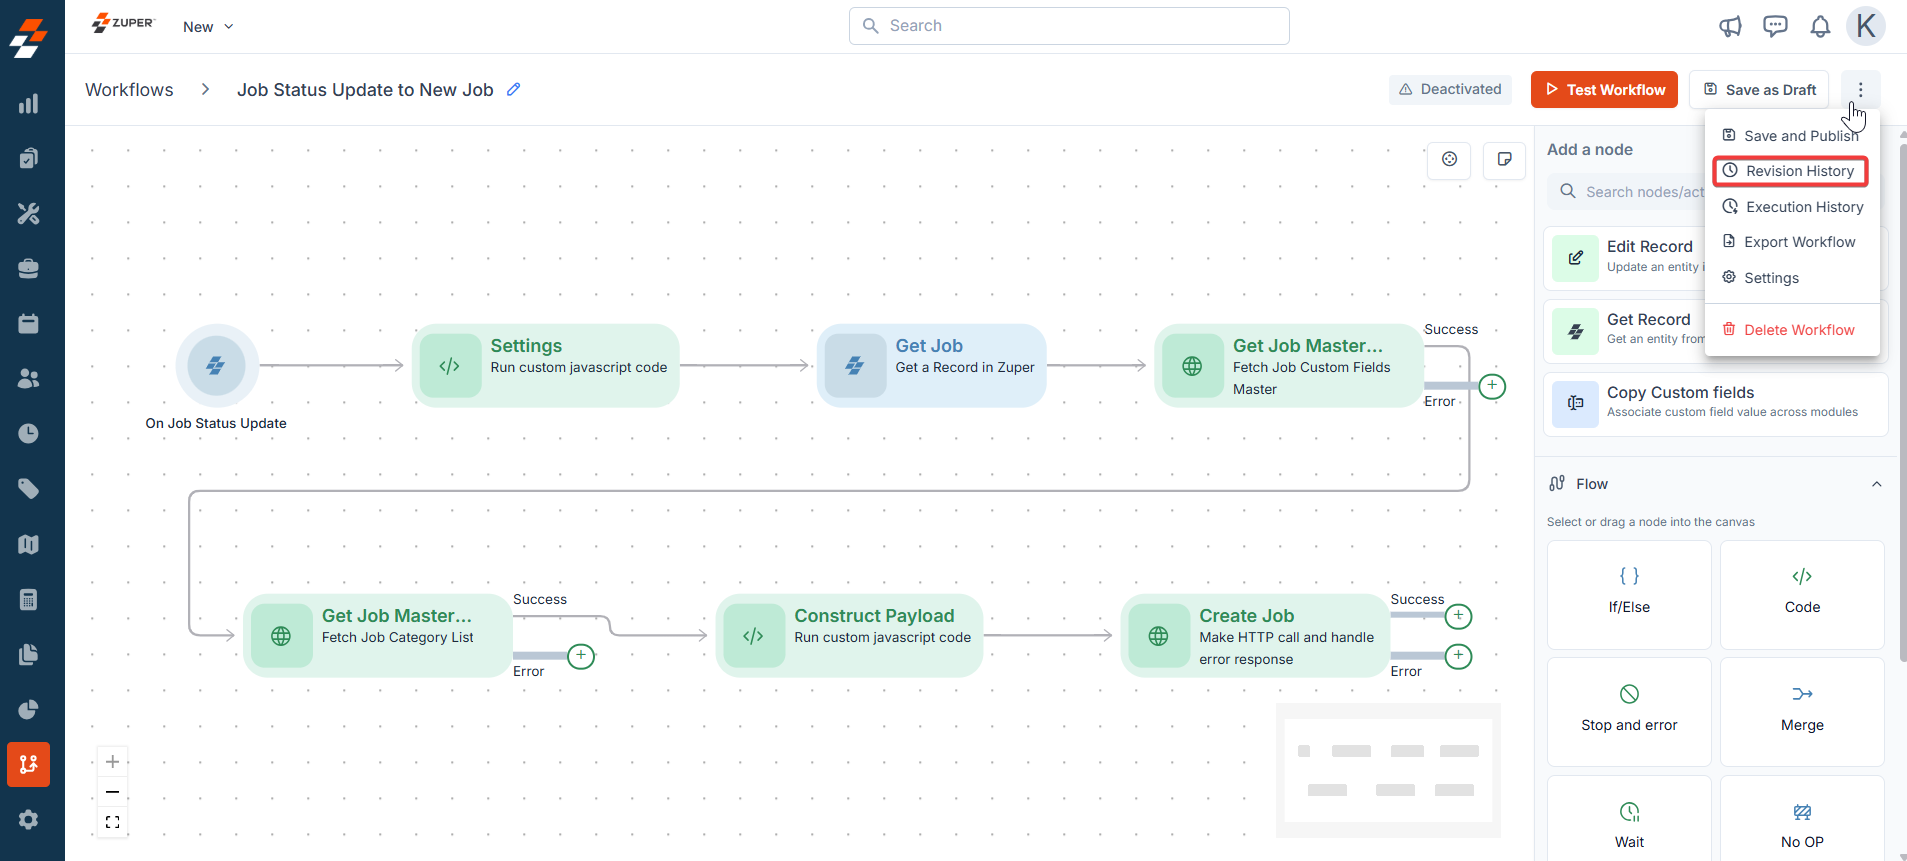
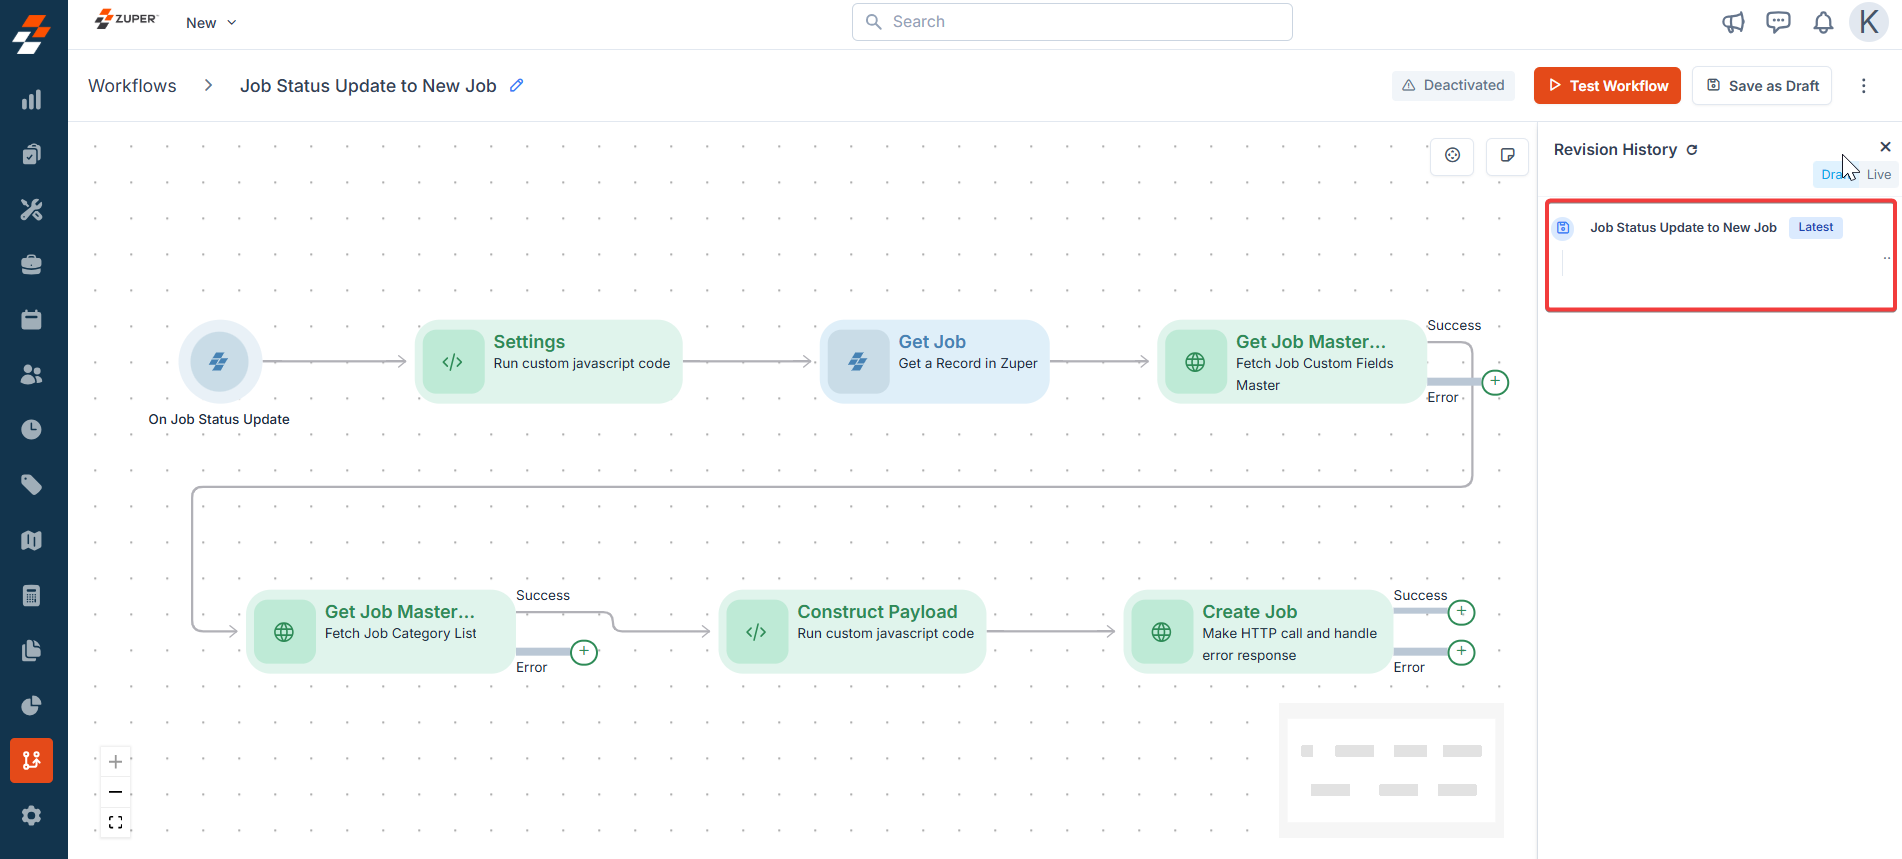
- You can view the live and draft revision histories.
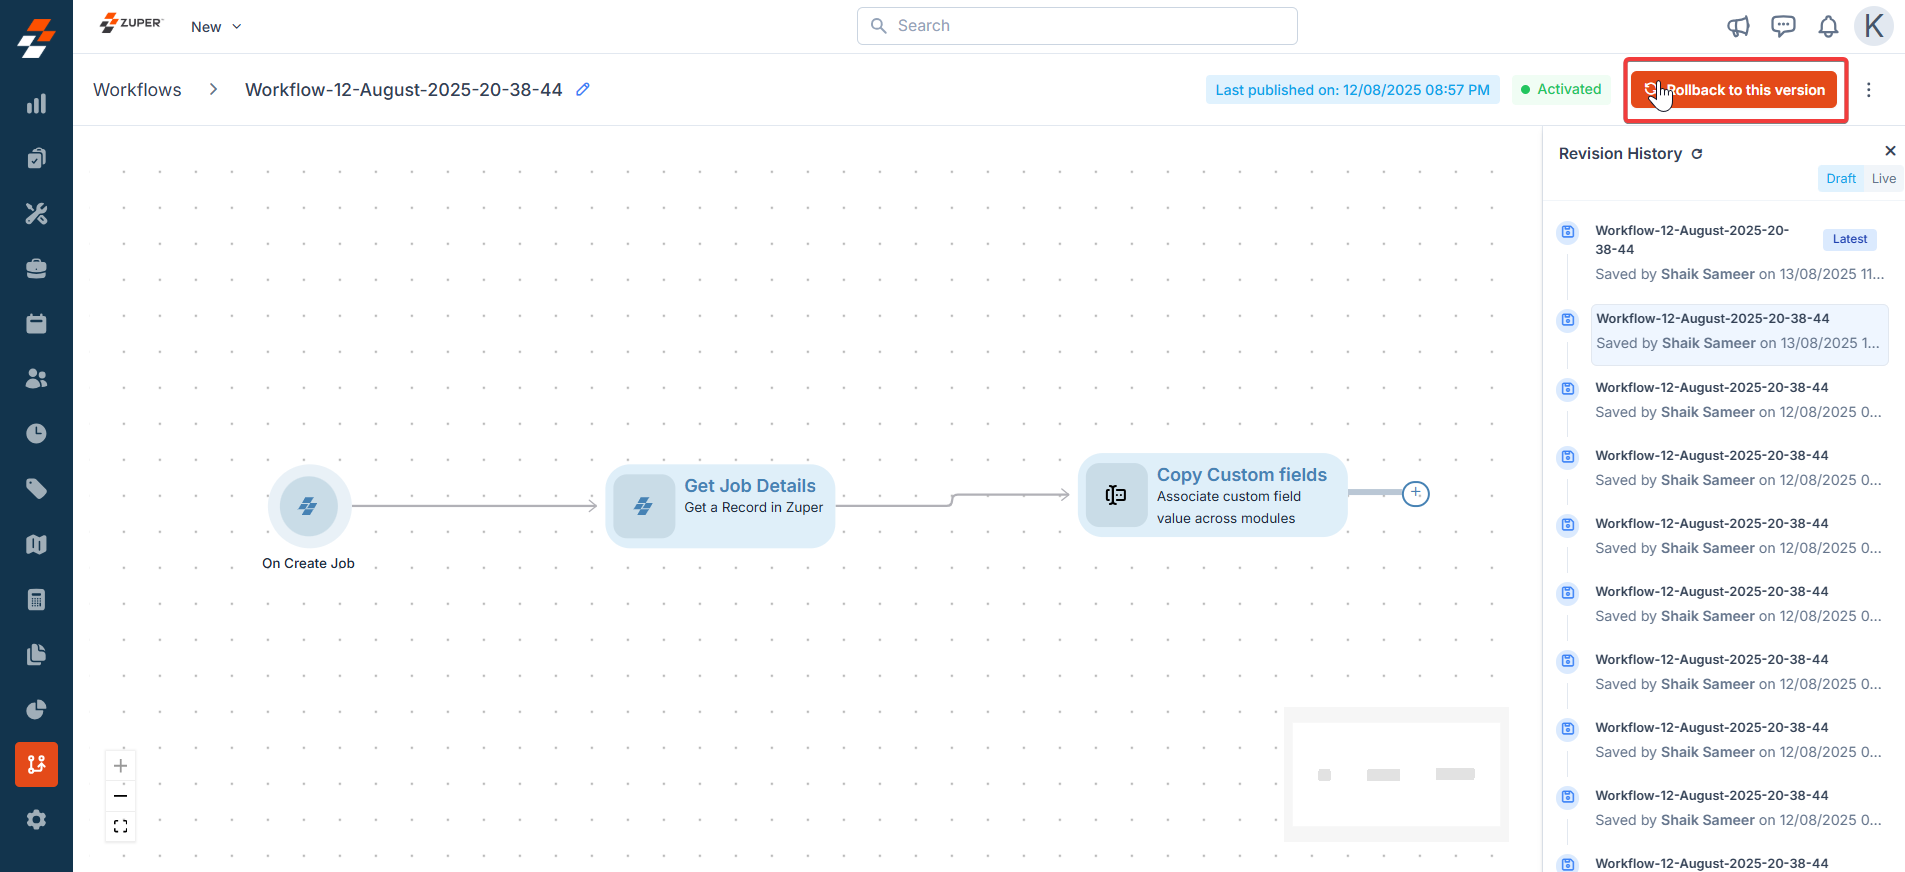
Rollback
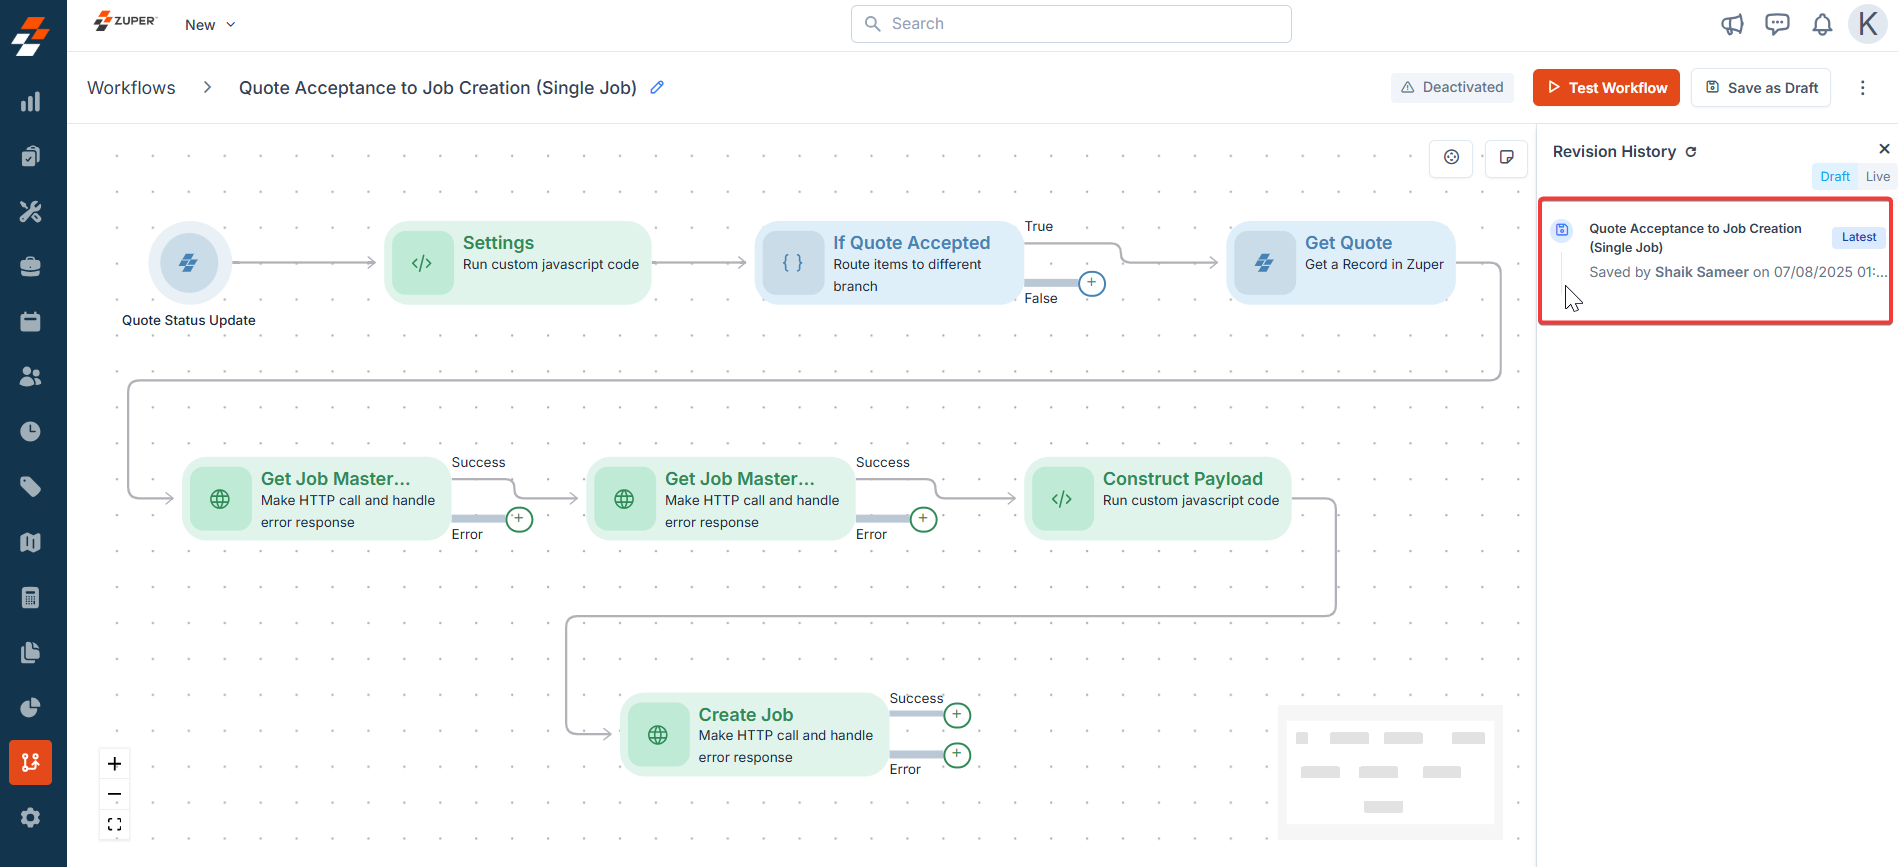
Rollback restores a workflow to a previously saved revision from Revision History. It replaces the current version with that earlier snapshot so you can quickly return to a known‑good state. Click any one of the histories from the sidebar. Now you will get the option“Rollback to this version.”
Monitoring
Overview- You can track runs at three levels: per-record (sidebar on the entity), per-workflow (from the workflow builder), and globally (Execution History).
- Actions available: View run details and retry failed runs.
- Known limitations: workflow-level history shows only the most recent 100 executions.
i)Record-level monitoring (Sidebar on the entity)
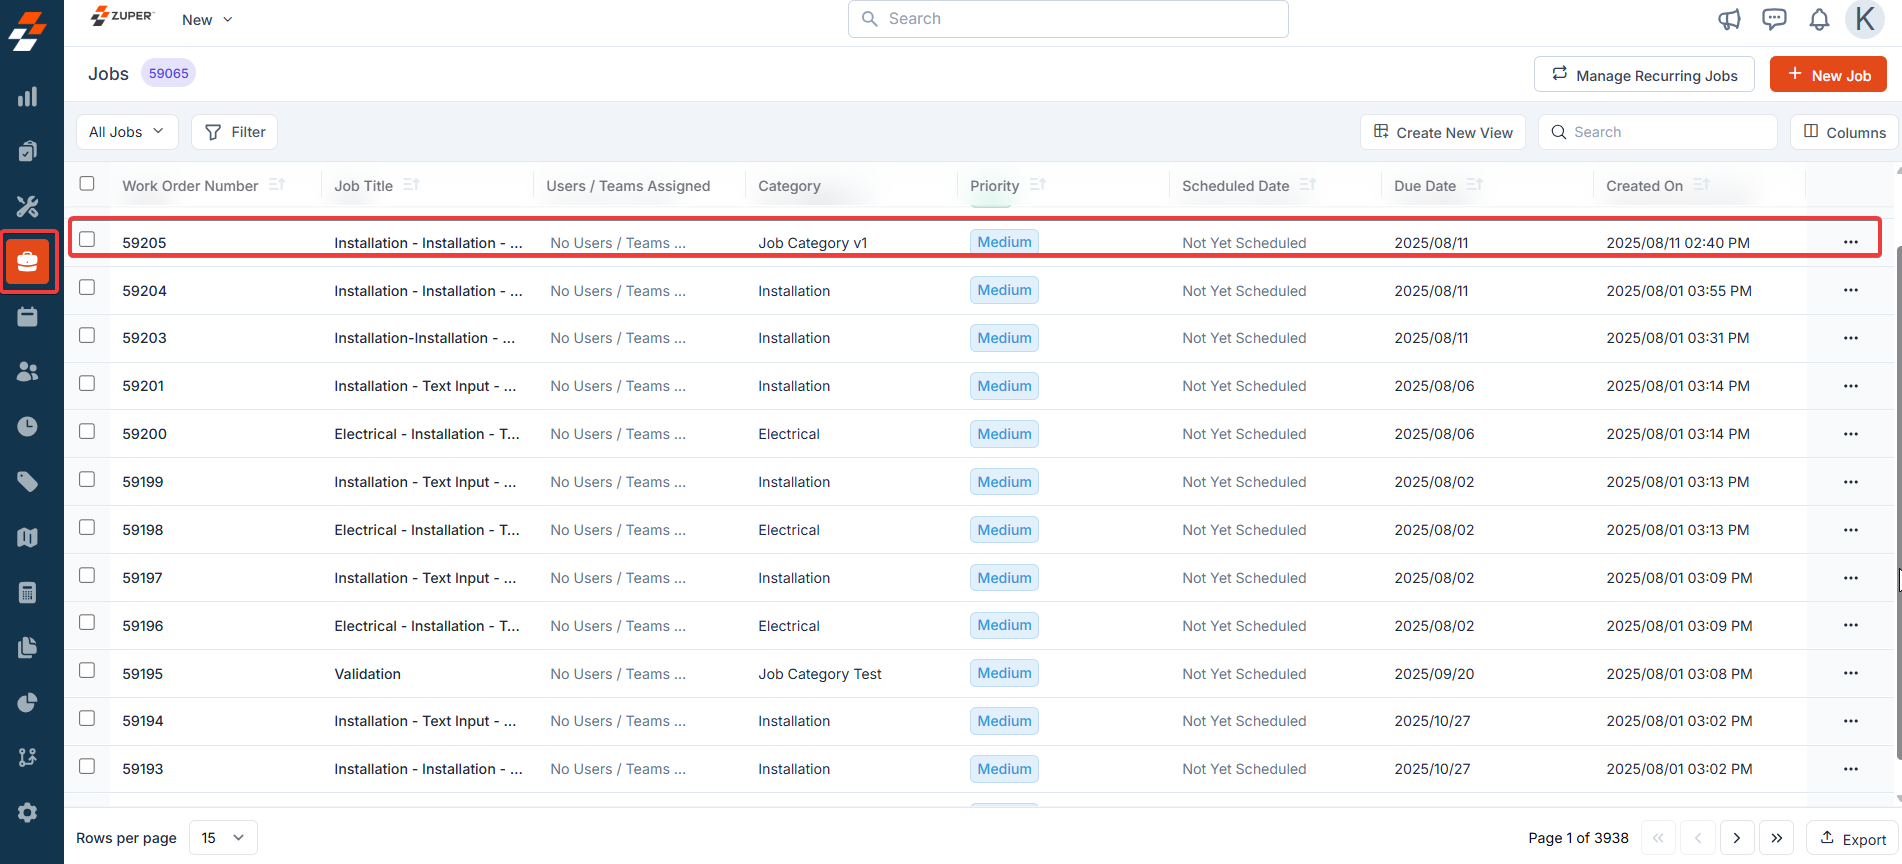
Note: This sidebar on the entity applies to all the modules. Below is an example of the Jobs module’s use case.
- Select the “Jobs” module from the left navigation menu and choose any jobs to view the job details page.
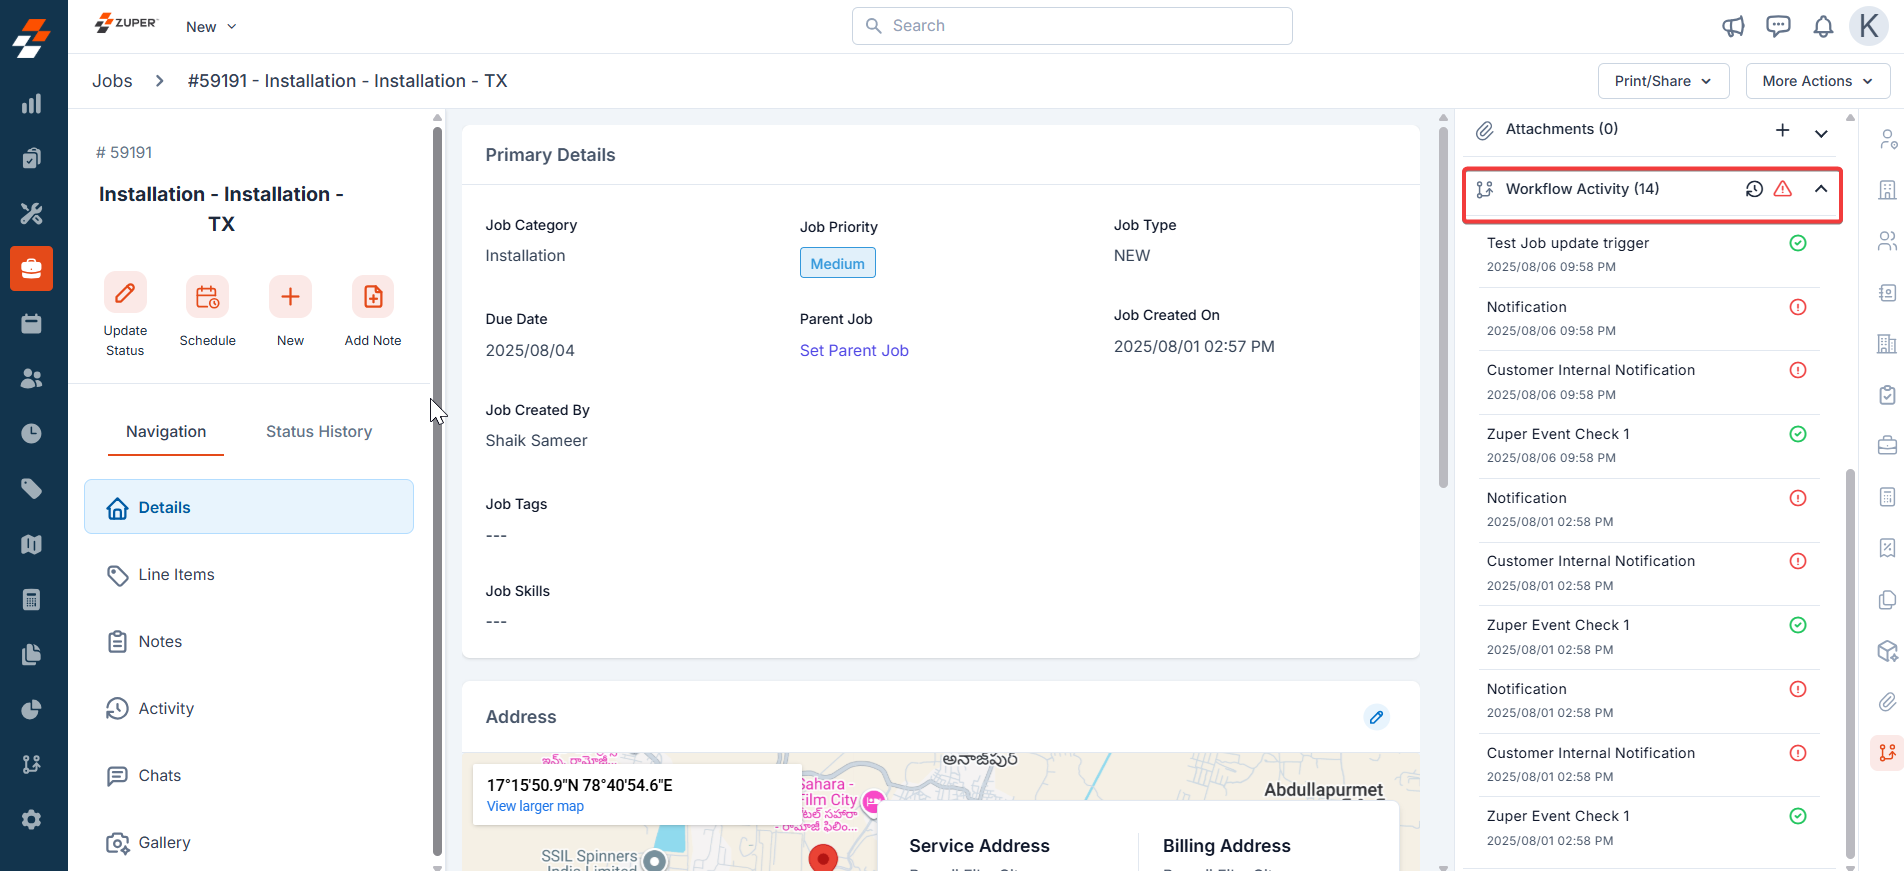
- Under the “Workflow Activity,” click any of the activities.
- On an entity (e.g., Job), the Workflow Activity panel shows recent runs tied to that record, with success/failed indicators.
- Clicking the “View History” button opens the “Workflow Executions” list with:
Prerequisites
The workflow must use:- A Zuper trigger or at least one Zuper node, or
- A Webhook trigger configured with the correct x-module (i.e., mapped to the same entity type, such as Job). Without this, per-record executions won’t appear in the sidebar.
Filters
You can quickly filter the list by status (e.g., All, Failed) to focus on errors. 1. Click the retry icon to retry the workflow for the failed executions only.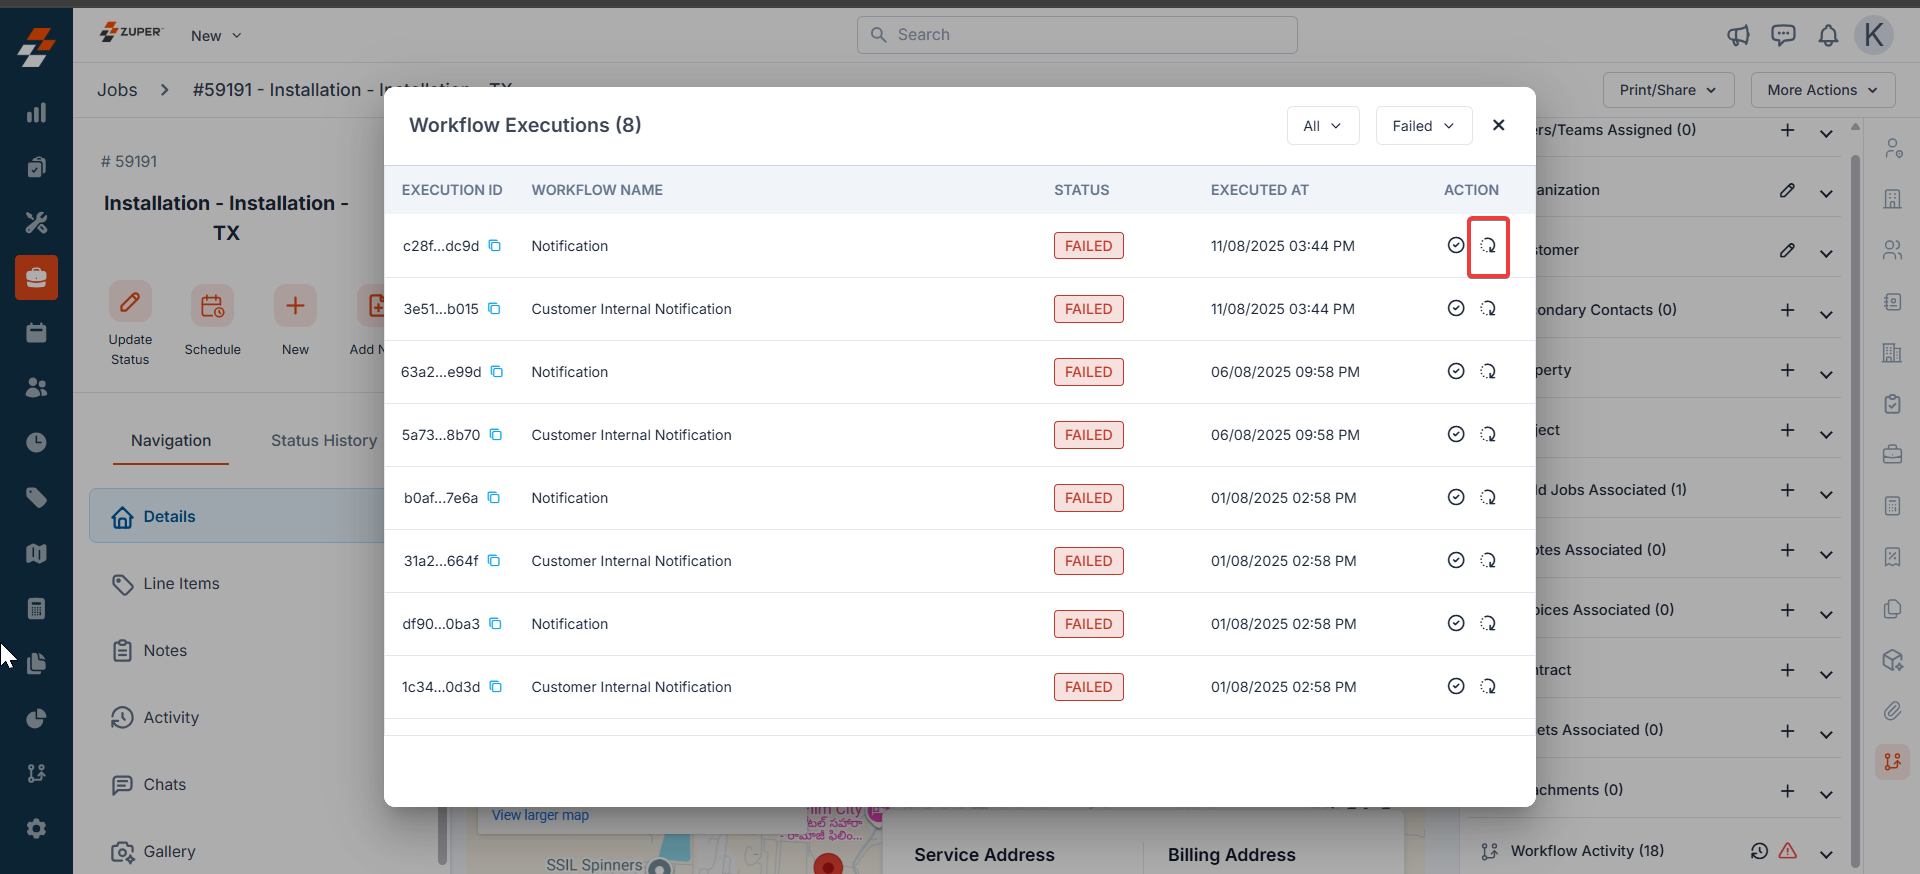
- The system will retry the execution.
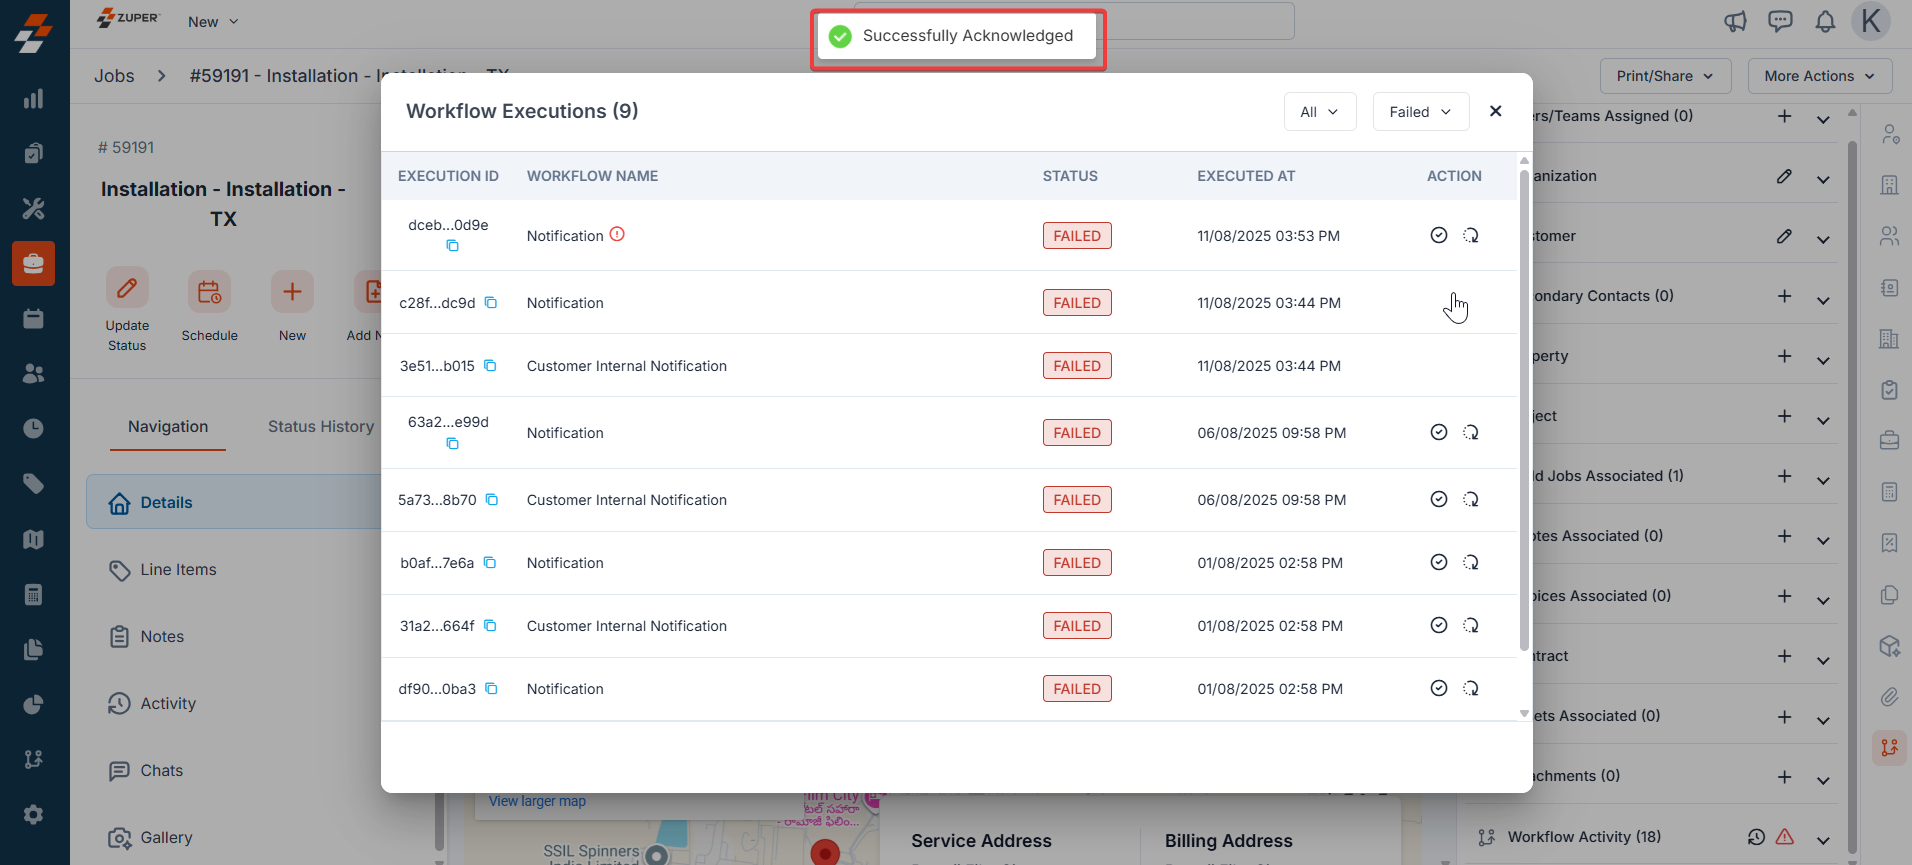
- Click the icon to acknowledge the workflow. If you want to fix the issues manually and want other admins to avoid retrying, you can simply acknowledge, which will remove the retry option.
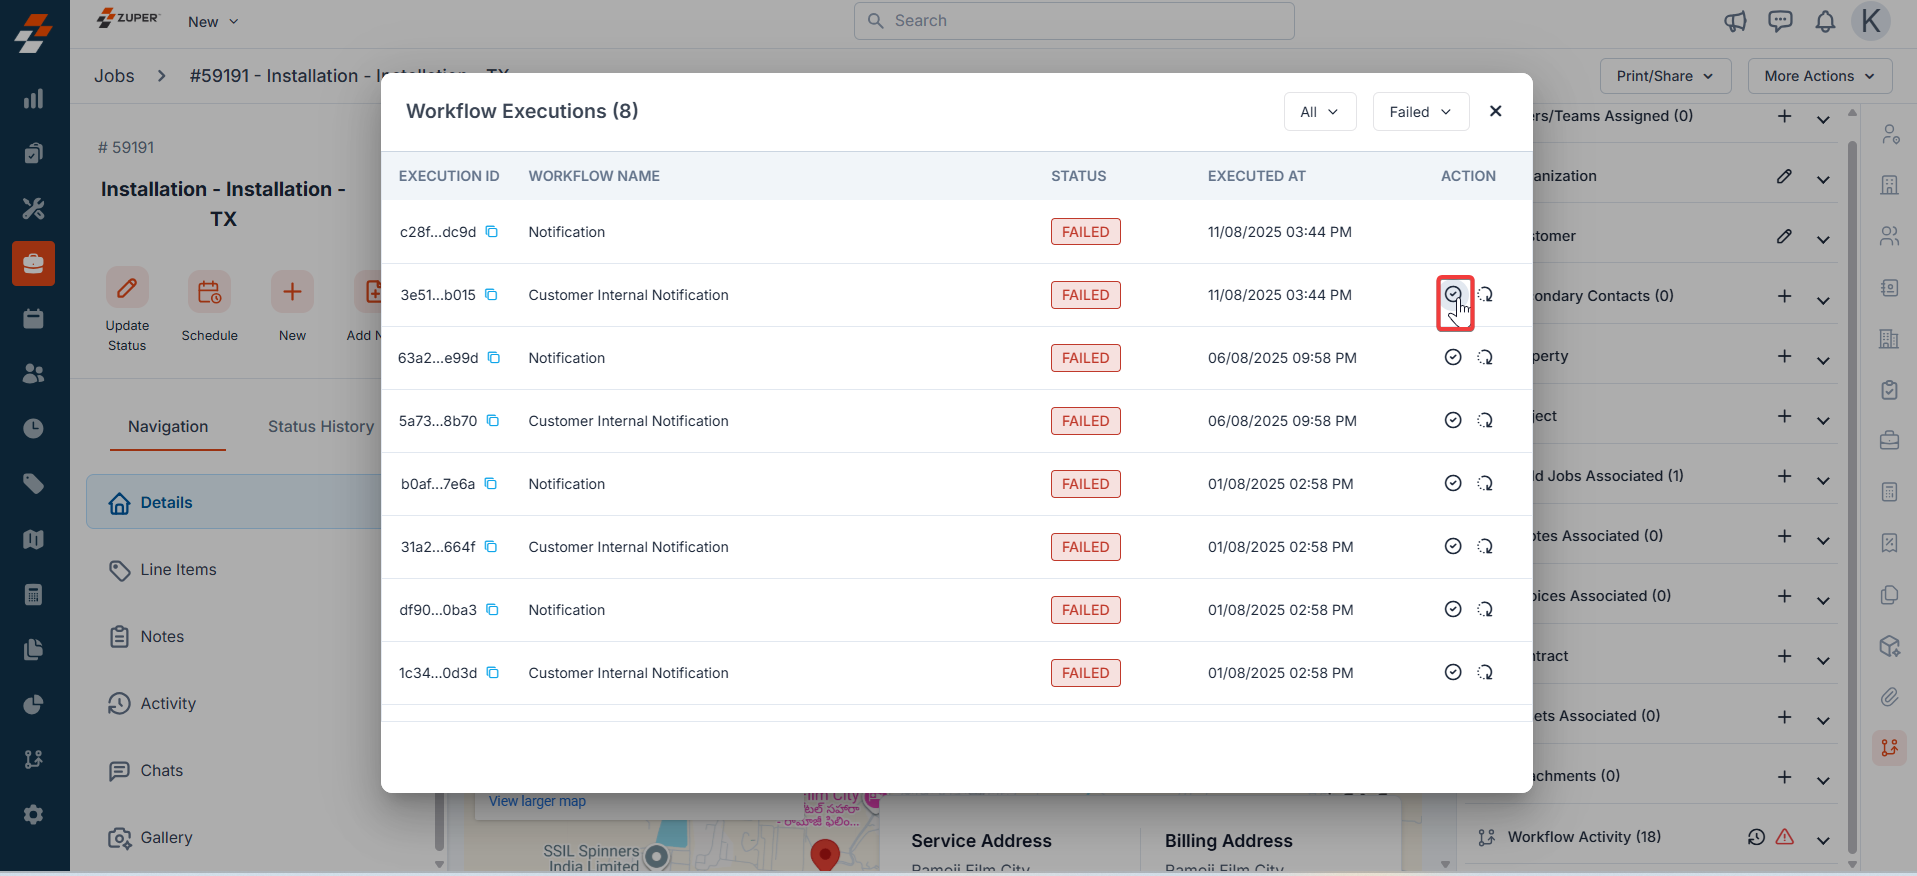
- The acknowledgment is successfully done.
ii) Workflow-level monitoring (within a specific workflow)
Access Choose Execution History to see runs for that workflow. What you get- A list of the most recent executions for that workflow.
- Limitation: Only the latest 100 executions are shown at the workflow level.
iii) Global-level
Access the Execution History tab to review past workflow runs and monitor their performance. This section provides critical details for tracking and troubleshooting: Filters: Use dropdowns to filter by Workflow, All Status, Triggered Date, and Mode. Check the “Flagged” box to view only flagged items. Search: Enter a Workflow Name in the search bar to quickly find specific executions. Columns:- Execution ID: Unique identifier for each execution.
- Workflow Name: Name of the executed workflow.
- Triggered at: Time when the workflow was initiated.
- Executed at: Time when the workflow was processed.
- Status: Indicates success, failure, in progress, or queued.
- Time Taken: Duration of the execution, with warnings for failures.
- Total Executions: Displays the number of executions for the current month, along with the remaining quota.
- Pagination: Navigate through pages using the controls at the bottom.
- Created Time: The timestamp when the workflow is queued or initiated in the system. Due to system processing or queueing delays, this may be slightly later than the Triggered Time.
- Triggered Time: The timestamp when the trigger condition is met (e.g., when a “Job Created” event occurs or a webhook is received).
- Troubleshooting: A large gap between Triggered Time and Created Time may indicate system latency or resource issues.
- Audit Accuracy: Triggered Time confirms when the event occurred, while Created Time shows when the system began processing.
- Use Case: Use filters to quickly find problematic runs (e.g., all failed executions in the last week) or flag an execution for further investigation if it produces unexpected results.
Best practices and tips
- Always check the Revision History when failures cluster after a recent change.
- For webhook-triggered flows, confirm the x-module is set to the same entity you’re viewing; otherwise, you won’t see sidebar activity on the record.
- Before retrying, scan the error details to confirm whether a fix (credentials, mapping, condition) is needed first.
Common troubleshooting scenarios
- Record has no Workflow Activity entries: Confirm the prerequisites (Zuper trigger/node or correctly mapped Webhook x-module)
- I need to see older runs beyond 100: Use Workflows > Execution History (global view) and filter by the workflow name/date range
- Long delay between Triggered and Executed: Check for the concurrency limit set for a specific workflow.