Accessing the customization options
- Select “Dashboard” from the left navigation menu.
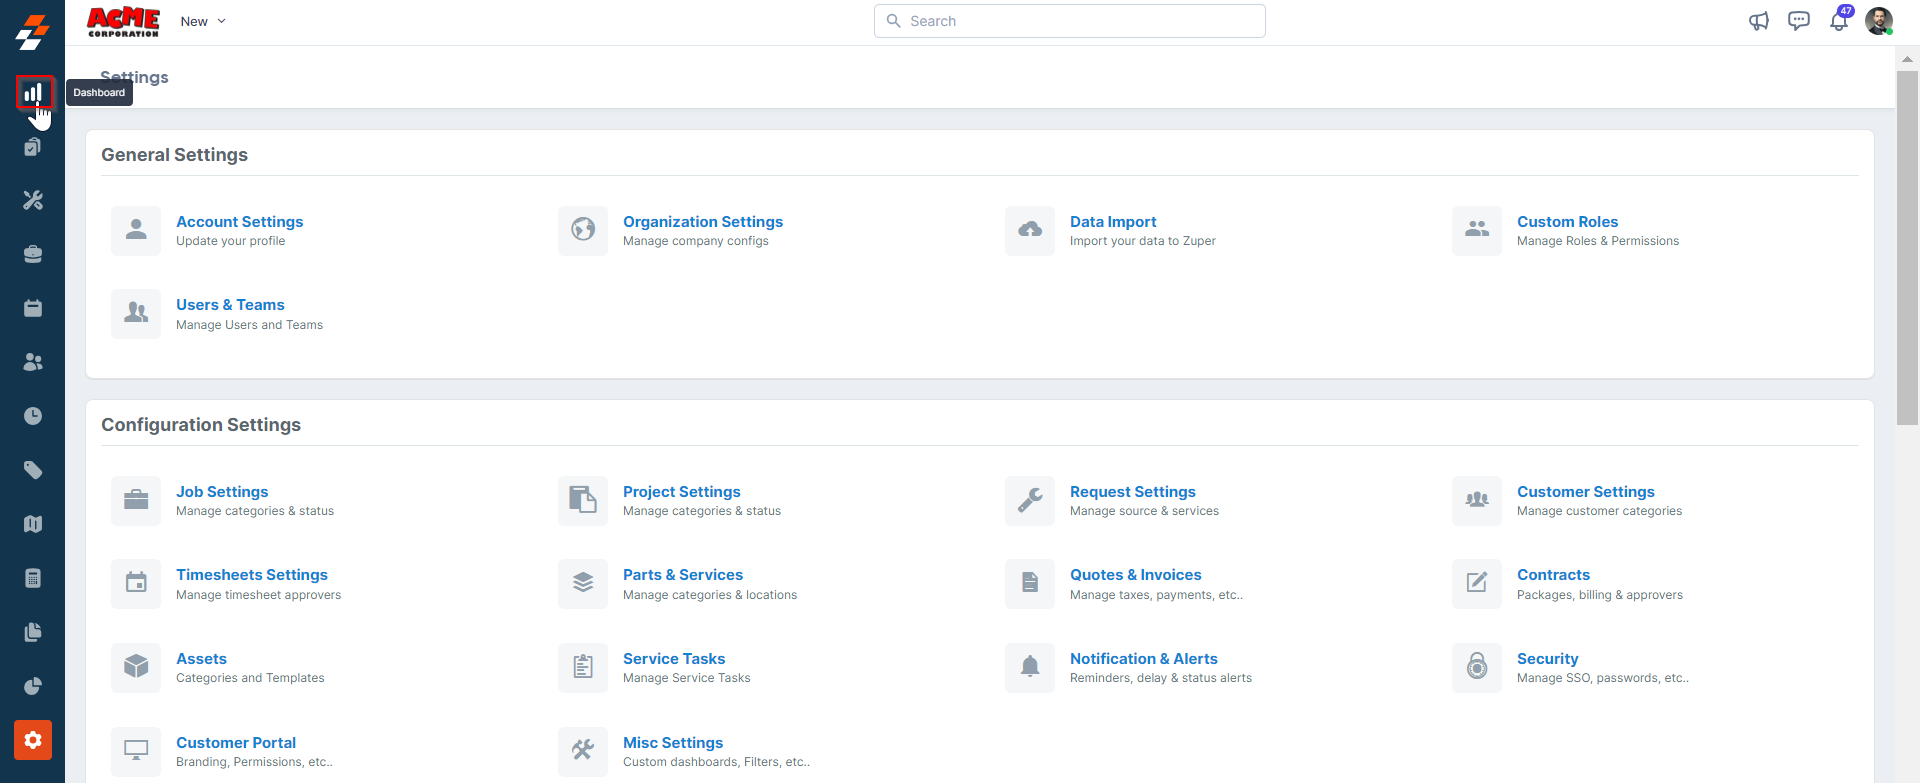
- You can view the default dashboard with various key metrics from each module.

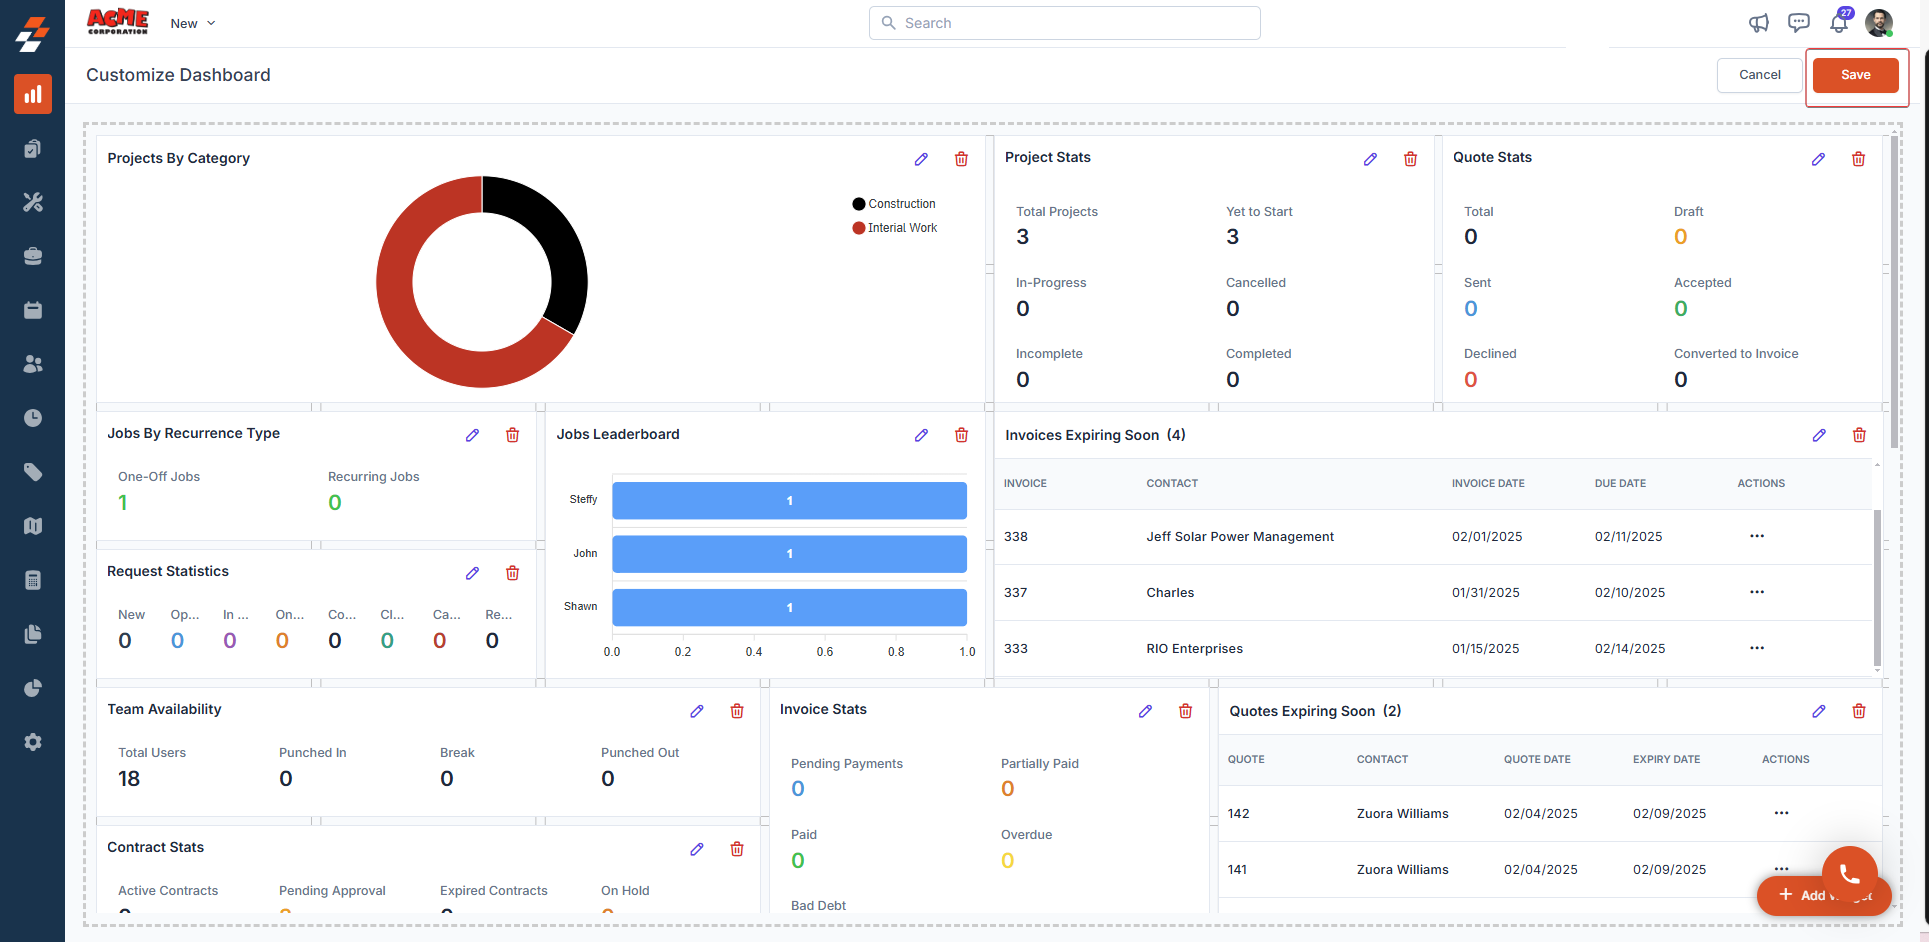
- Click the “Customize” button at the top right of the page.
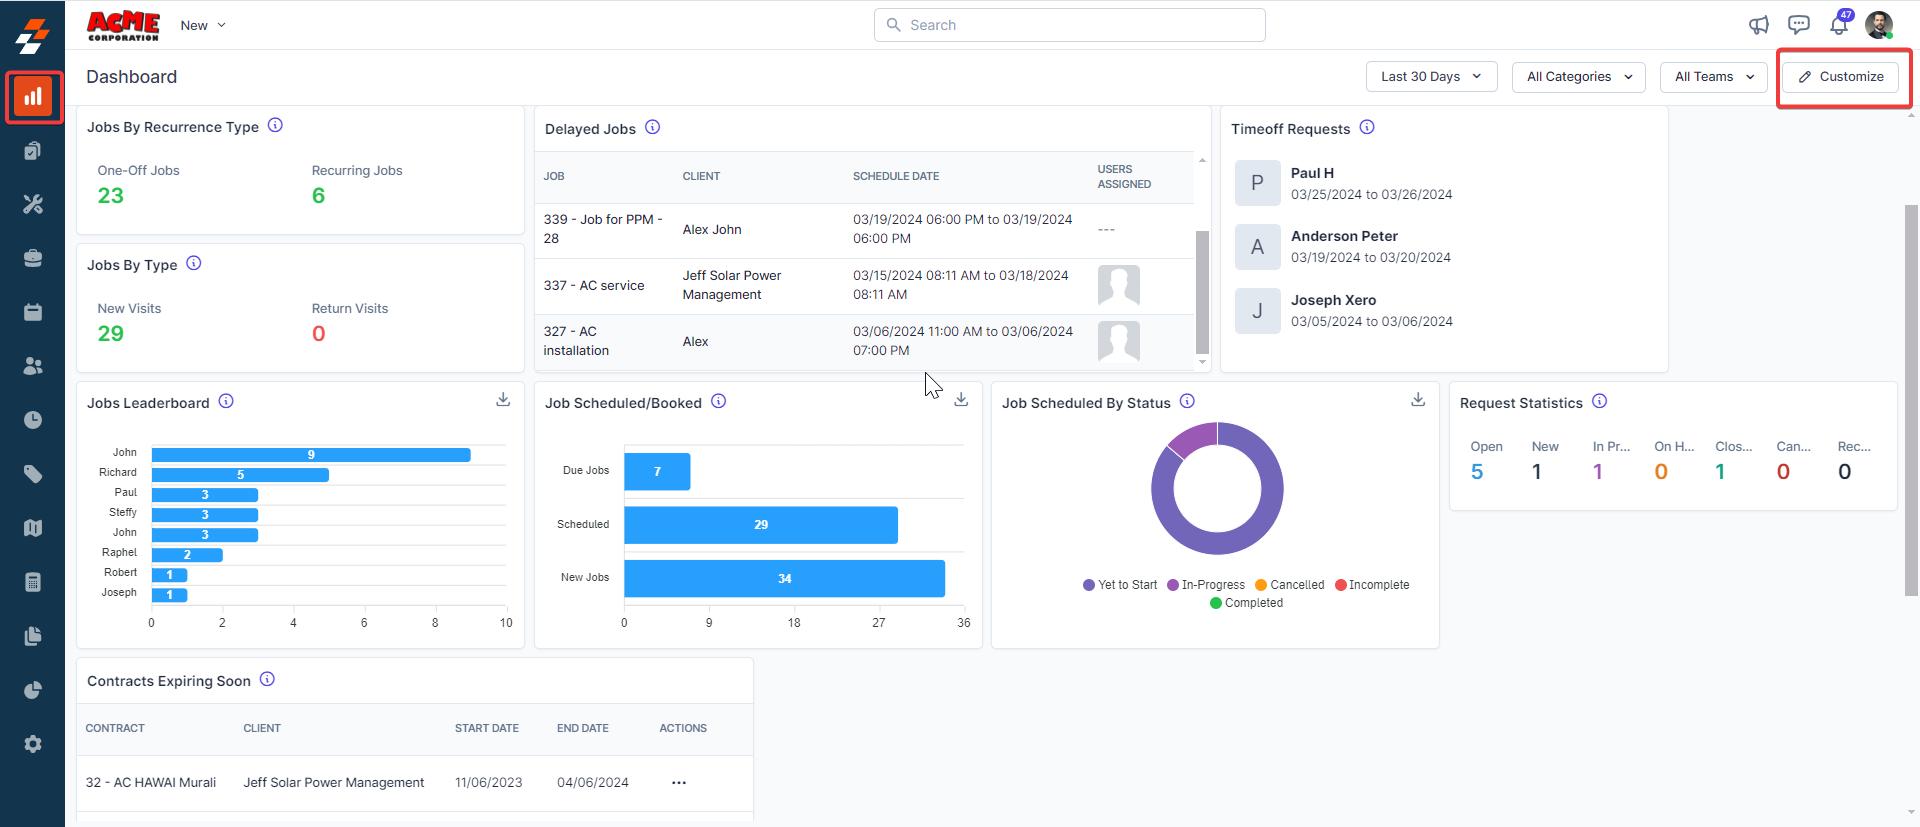
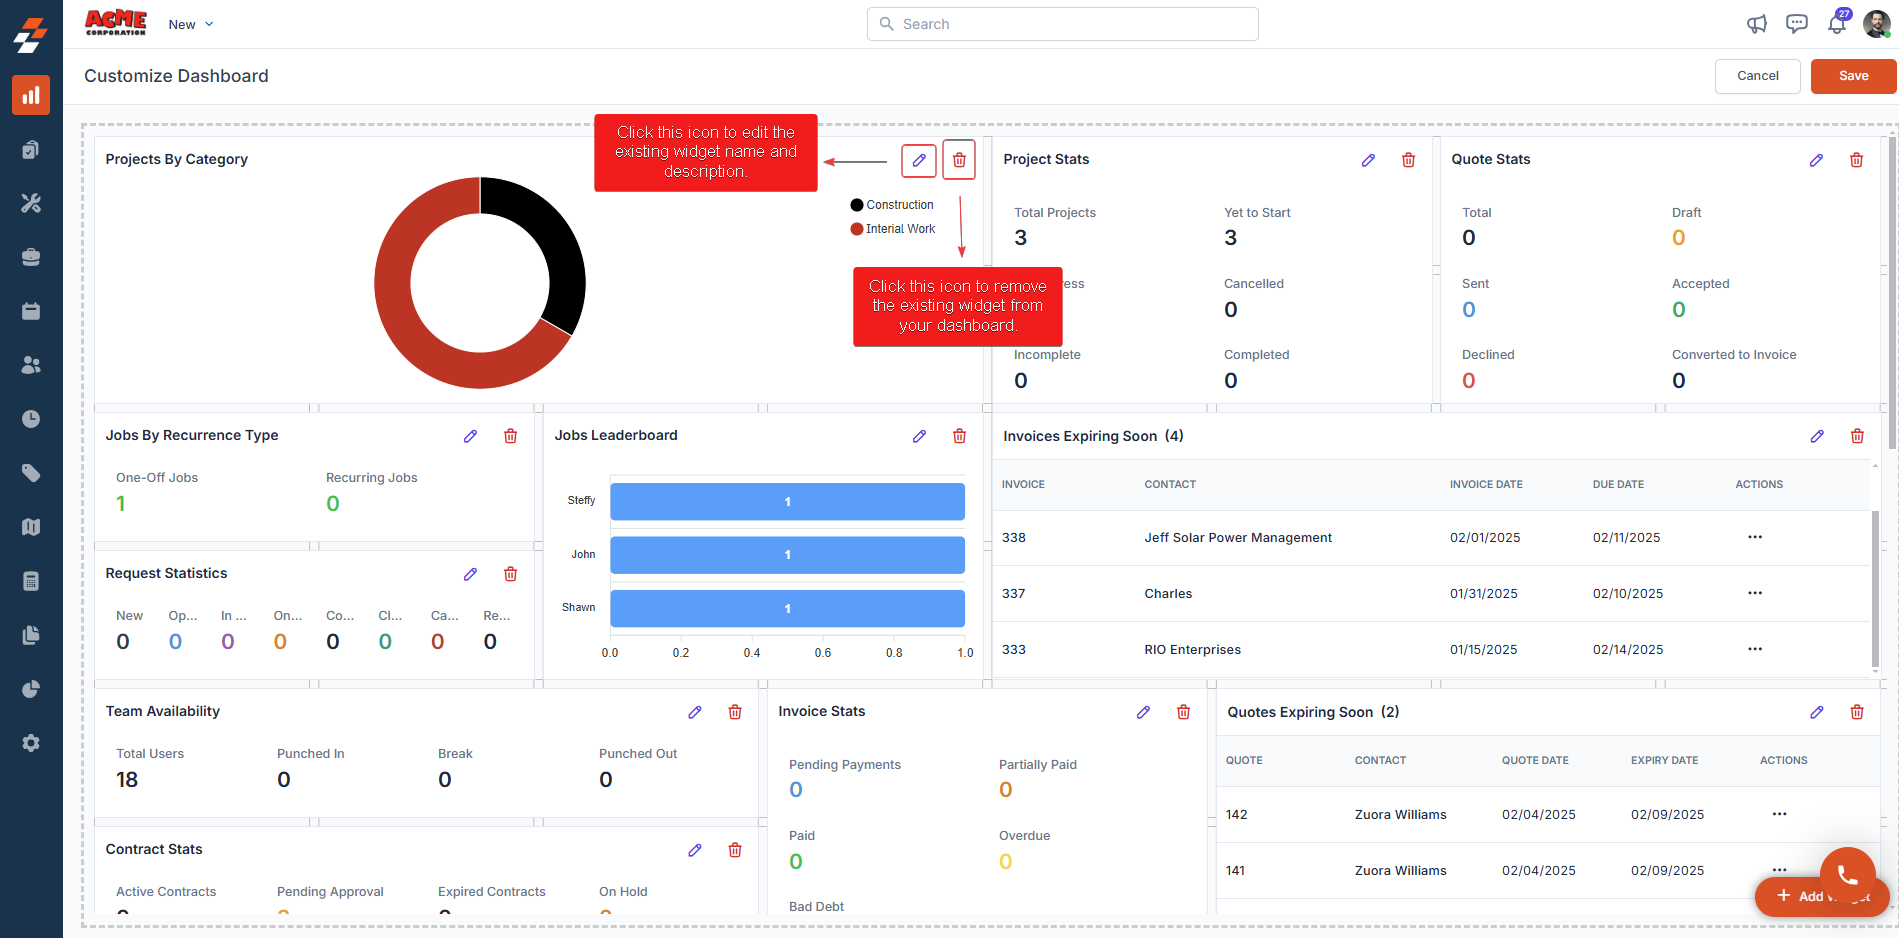
Adding widgets to your dashboard
Widgets are the building blocks of your Zuper Dashboard, allowing you to display specific metrics like job statistics, time off requests, or invoices.- Click ”+ Add Widget” in the customization panel.
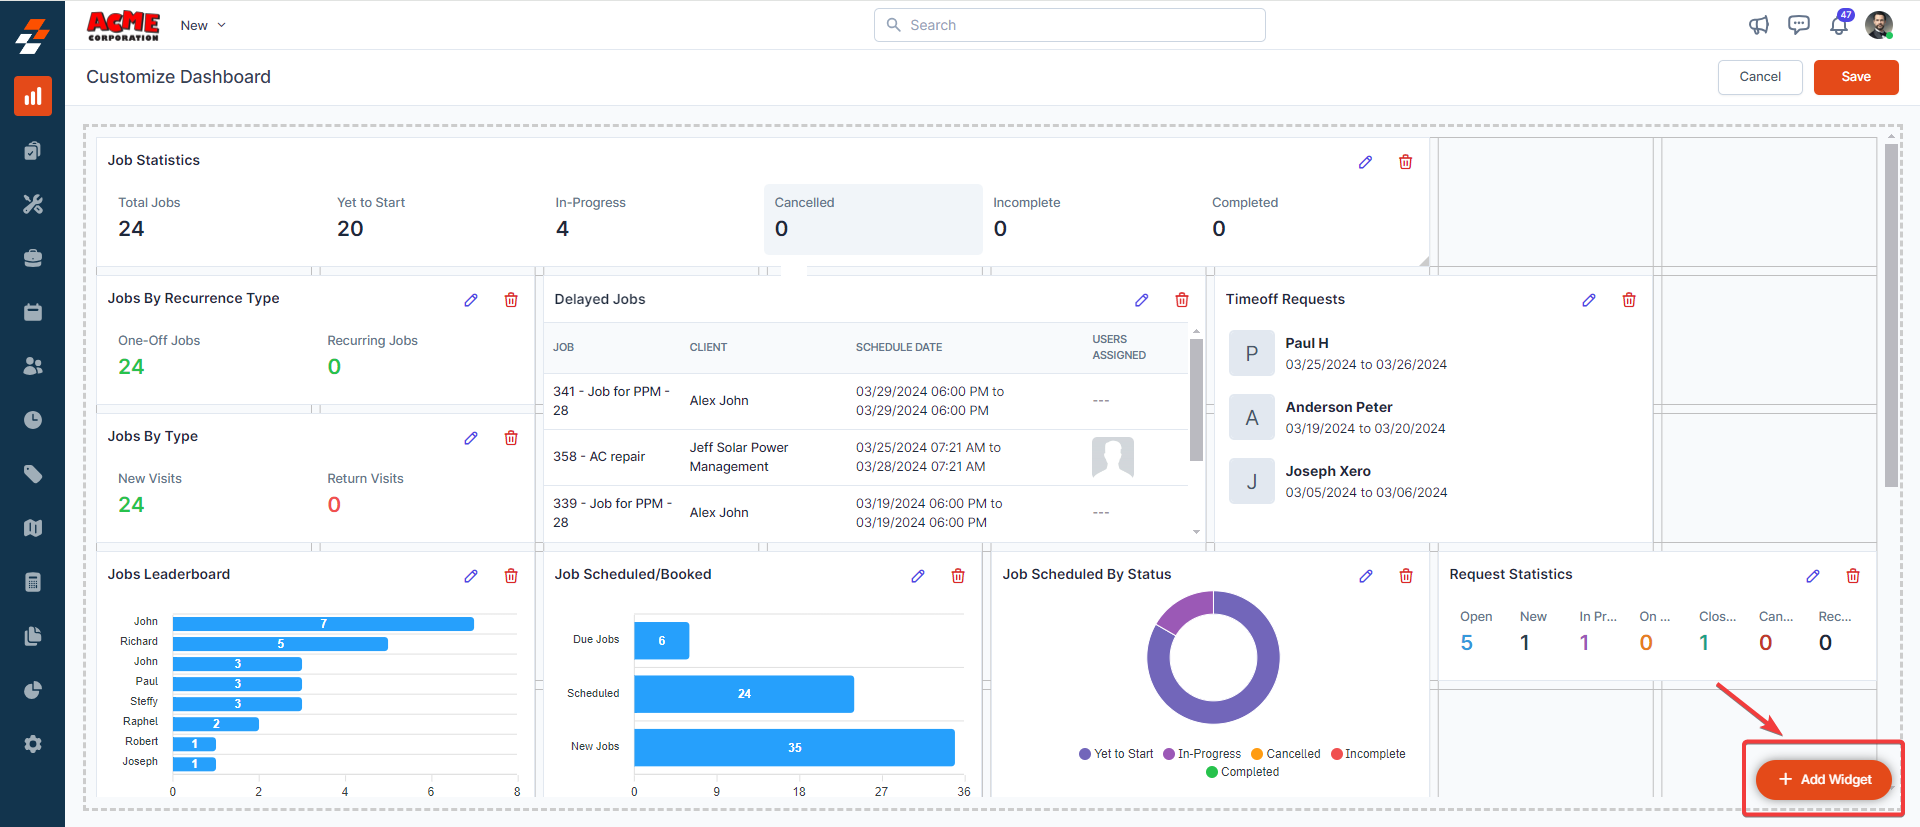
- Choose from a variety of widget options (e.g., Job Statistics, Timeoff request, or invoice).
- Click “Add” to place the widget on your dashboard.
- Drag the widget to your desired spot and resize it for optimal viewing.
- Click “Save” to apply the changes.
Customizing Dashboard Metrics: Time Frames, Categories, and Teams
Your dashboard metrics can also be adjusted by selecting different time frames, job categories, and teams. Using the actions menu at the top right, you can filter data by Daily, Weekly, Monthly, or Custom Ranges, refine insights based on job categories, and display team-specific information. Applying these filters ensures that you only see the most relevant data for effective decision-making.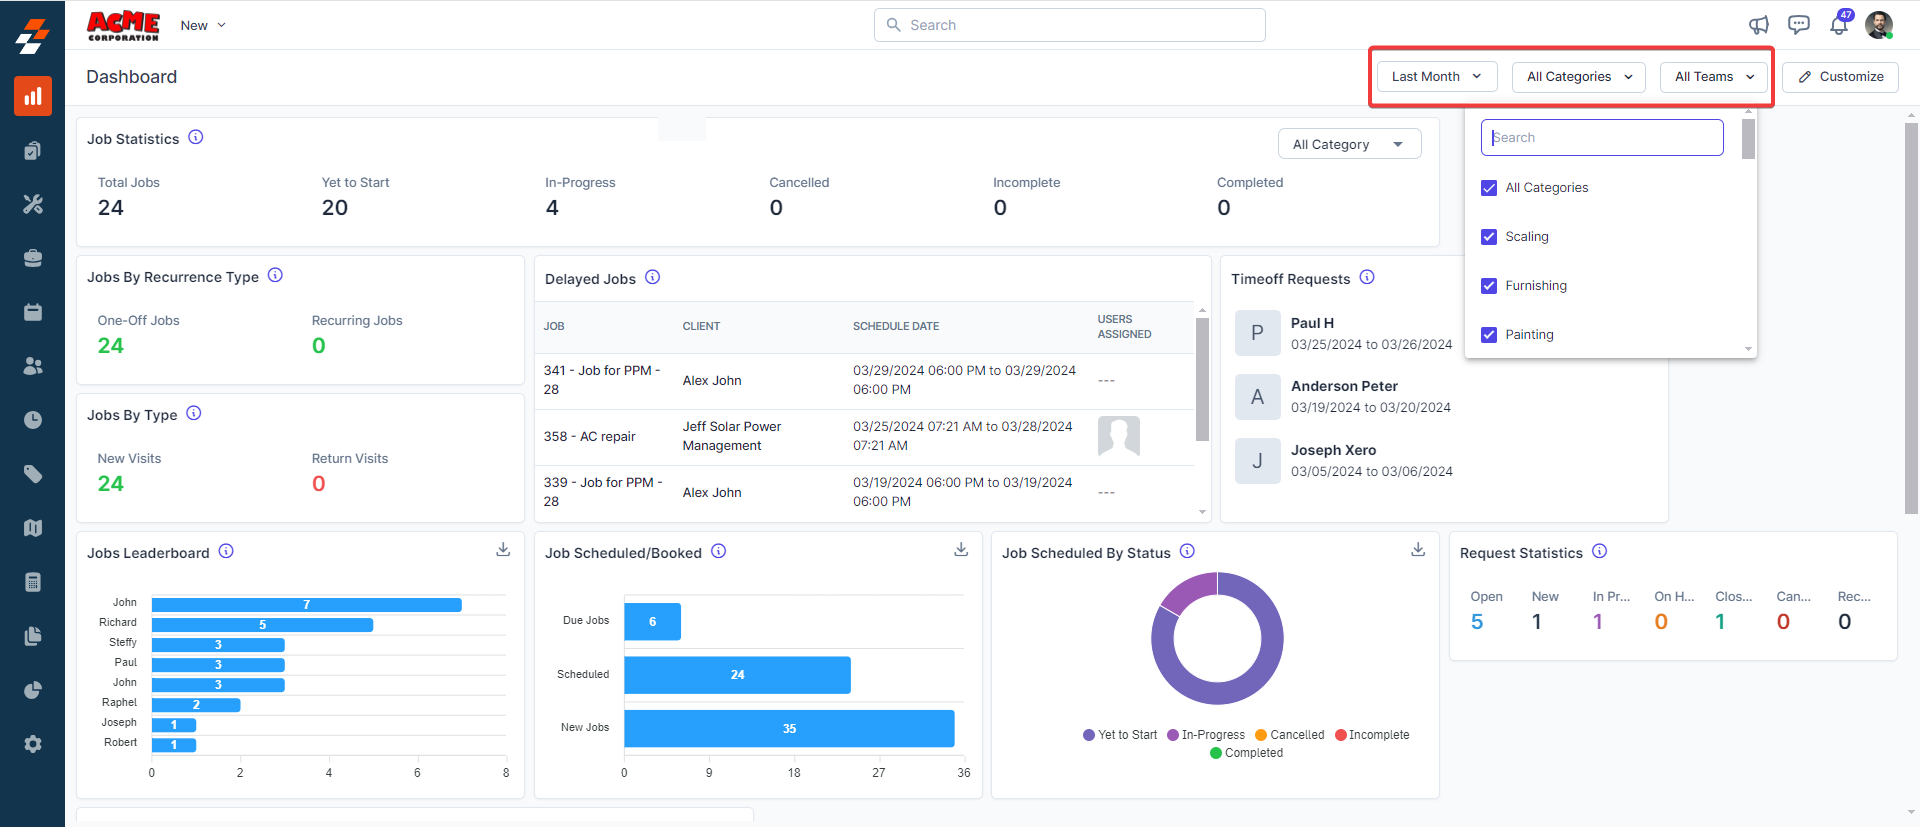
Downloading Graphical Representations of Metrics
You can download graphical representations of metrics by clicking the Download icon at the top-right corner of the widget Download icon on the widget’s top-right corner. The widget will be saved as an image file, which can be used for presentations, reports, or internal discussions.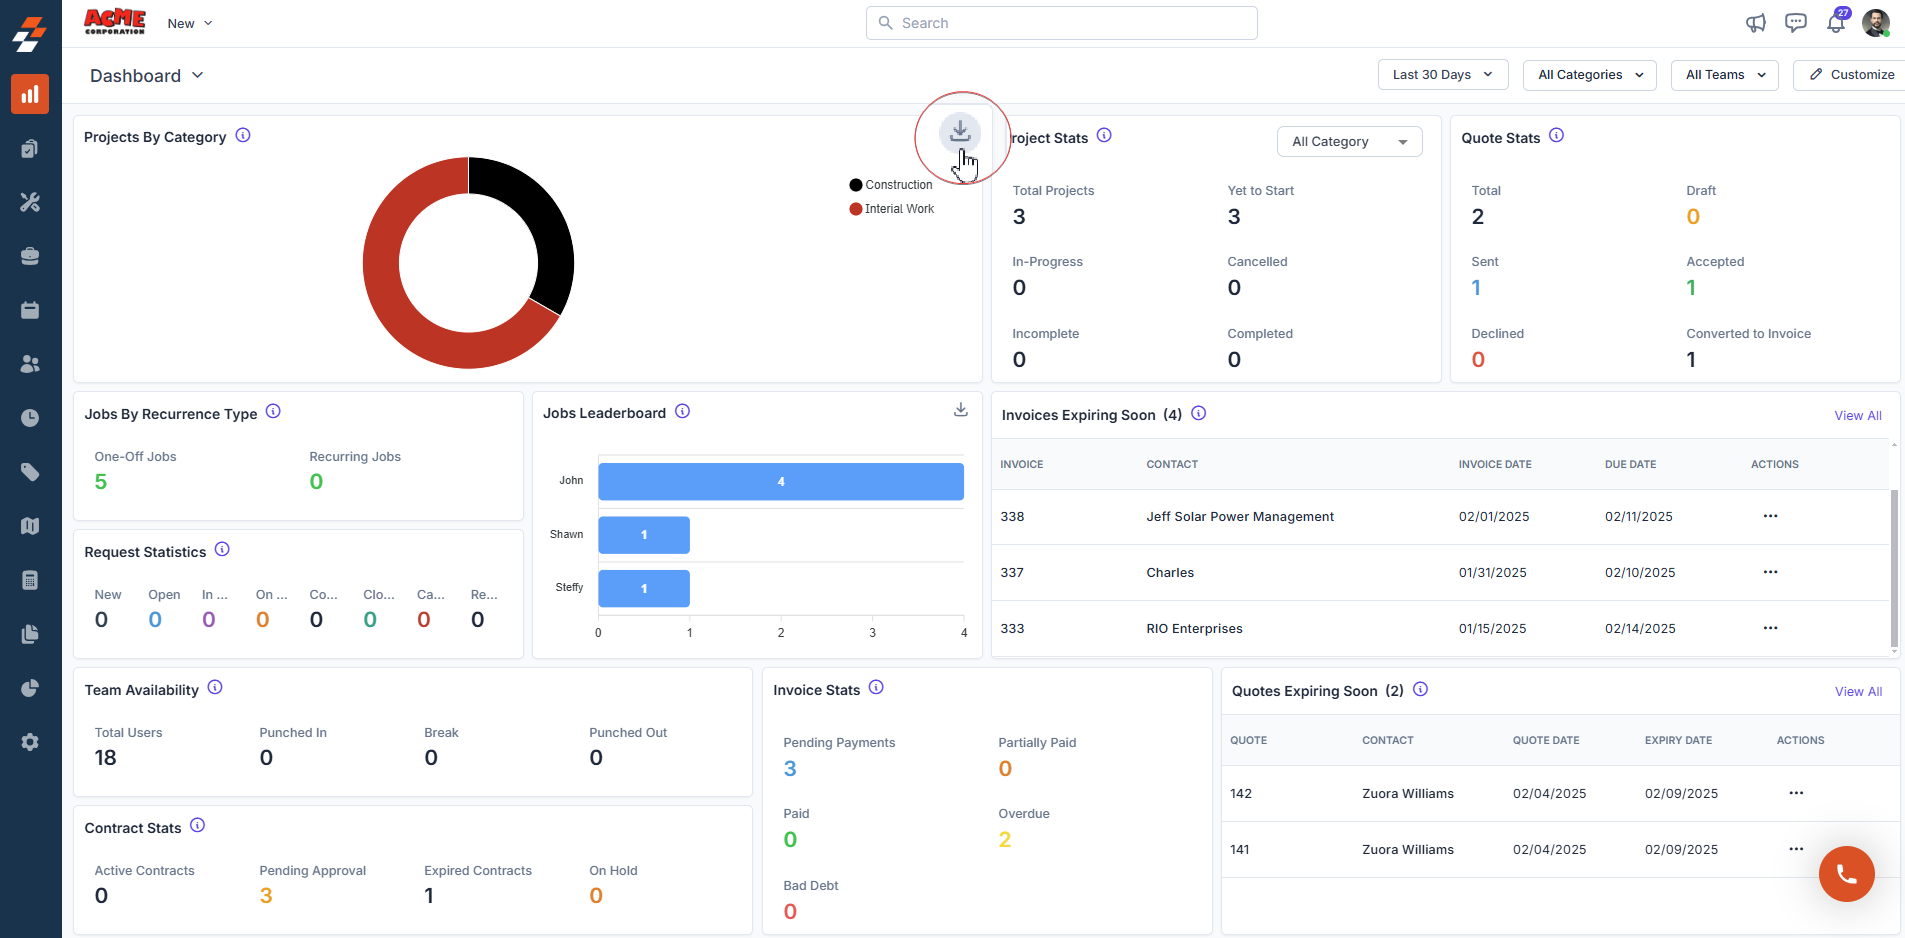 It’s that versatile! So why wait? Sign in to your Zuper web app today and start customizing your dashboard with interactive widgets that bring real-time insights to your fingertips. Tailor your experience by adding key metrics, adjusting filters, and optimizing layouts—ensuring a personalized, efficient, and data-driven workspace.