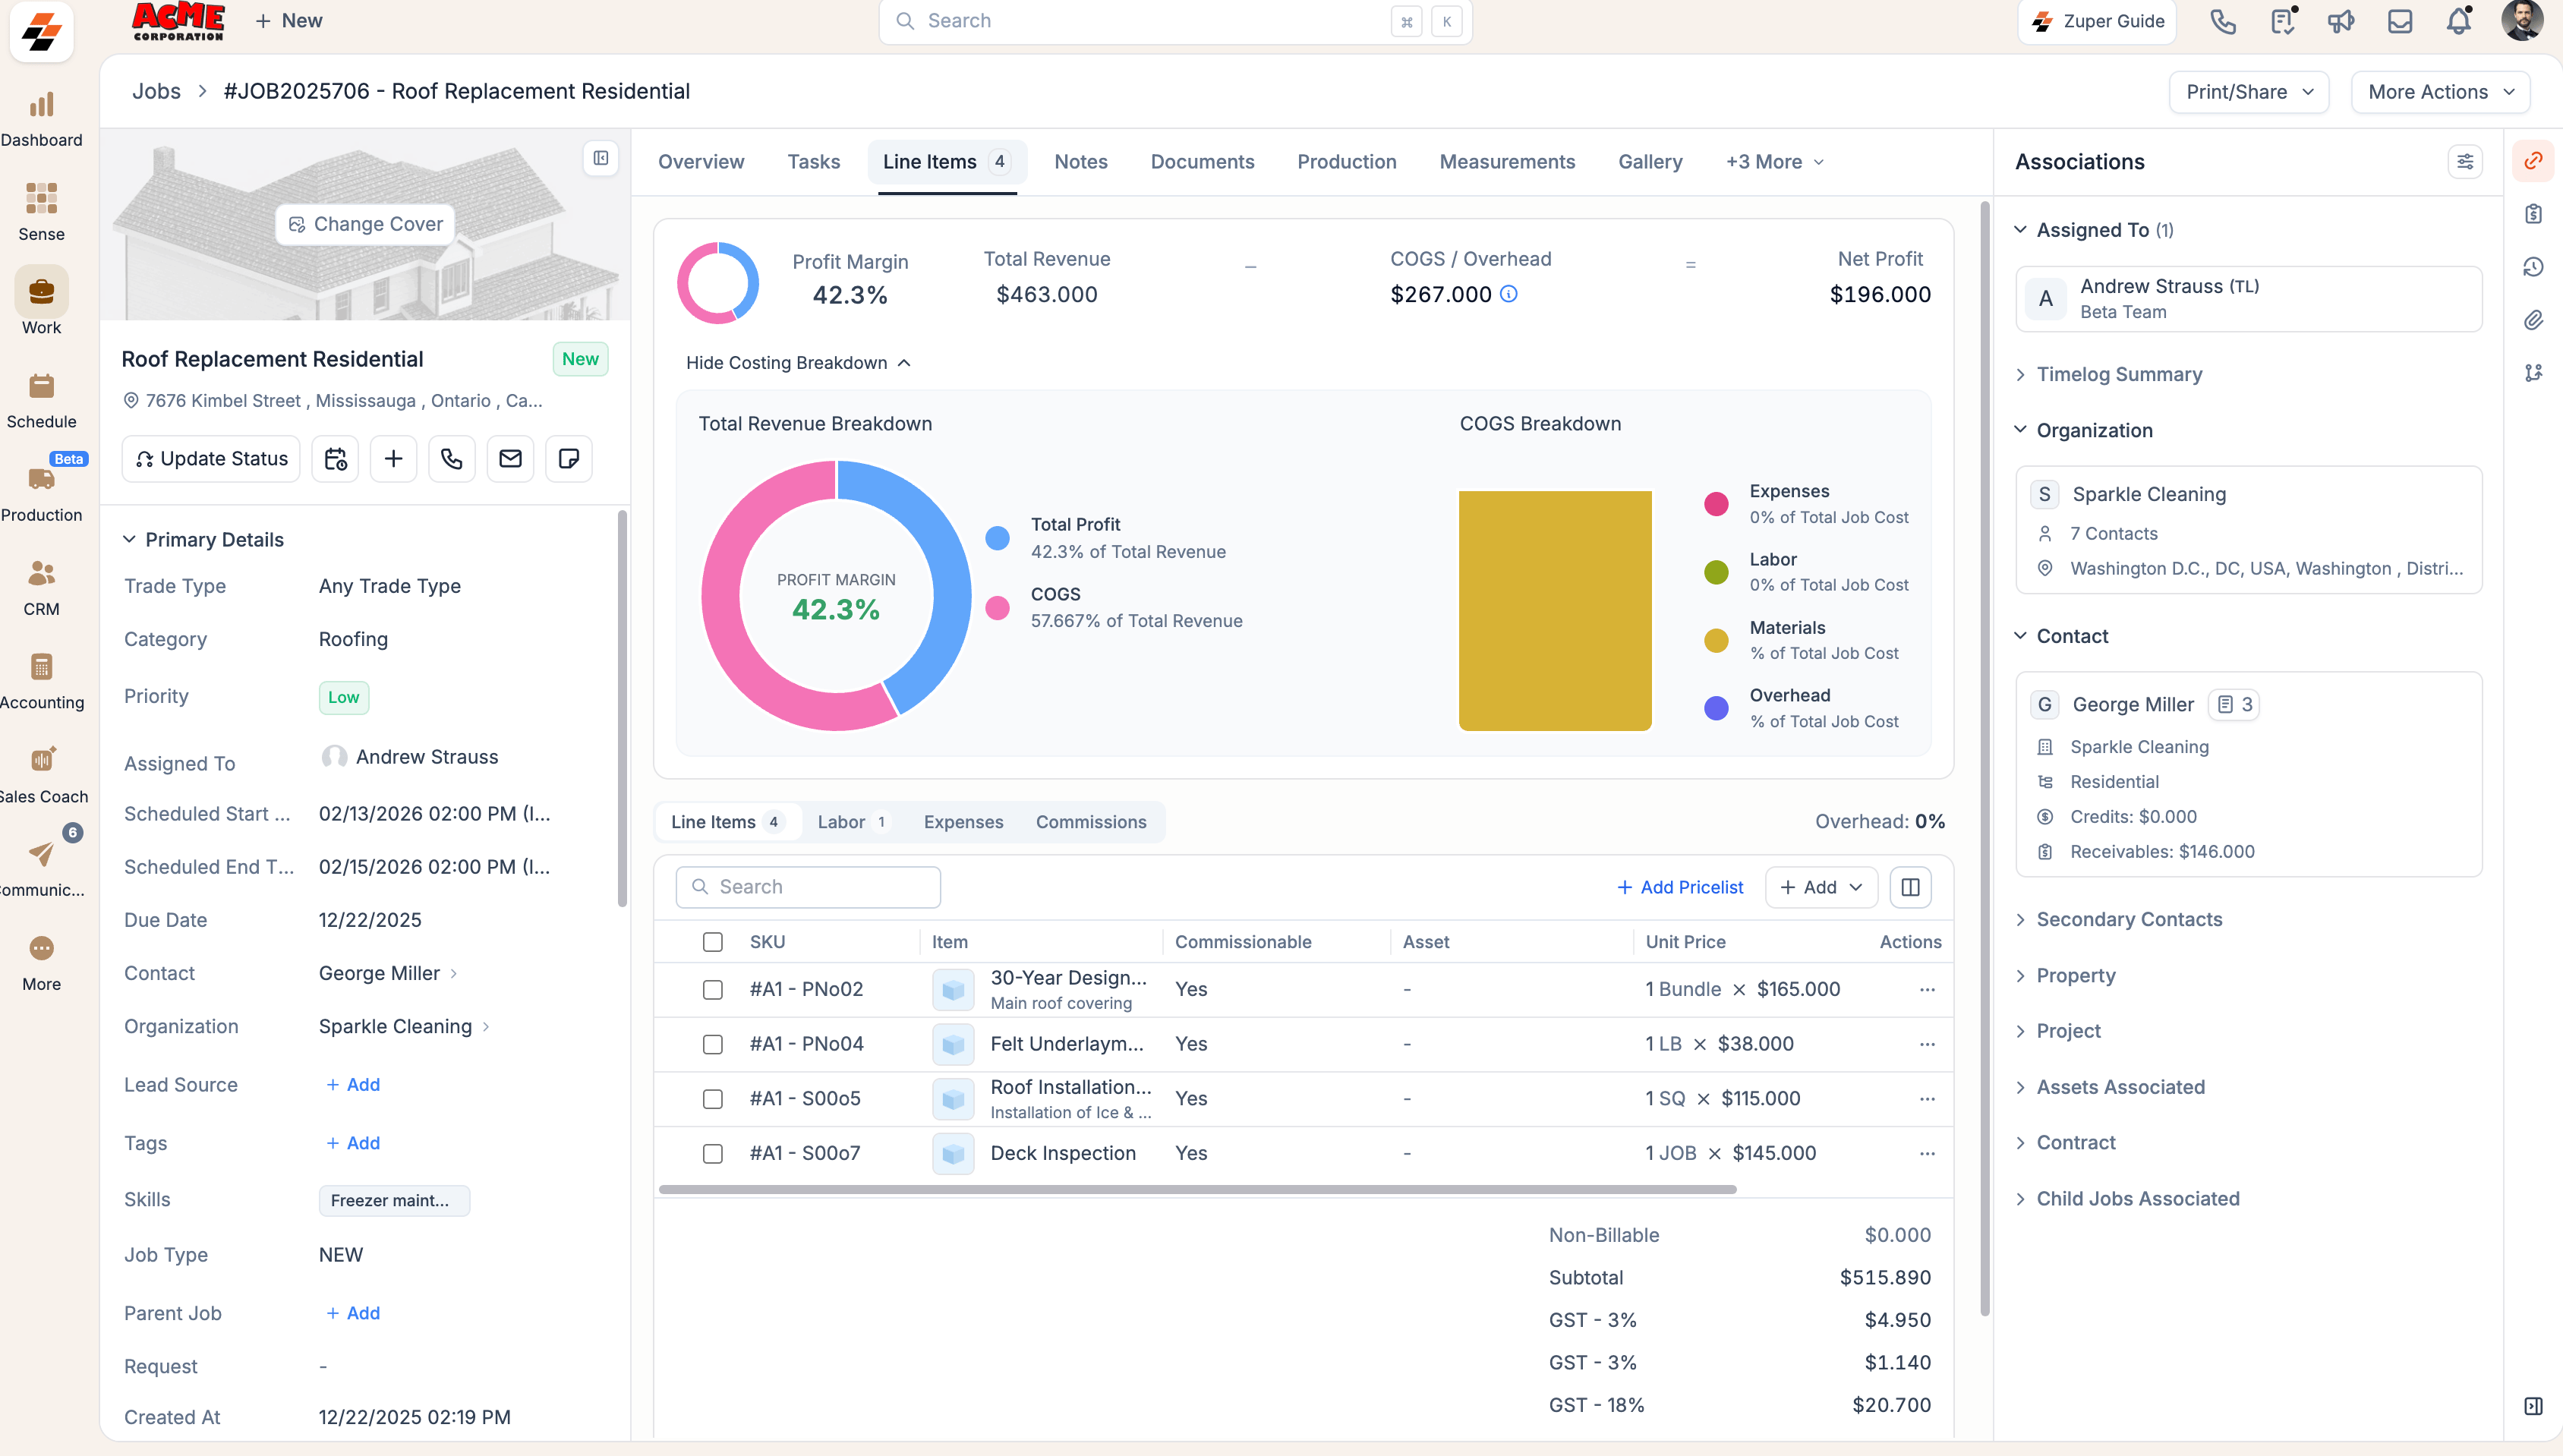
- Selling price of job line items
- Customer accepted quotes
Pre-requisites
- Ensure Job Profitability is enabled for your account. If not, contact your account administrator or email support@zuper.co to have it enabled.
- Configure required settings on the Job Costing & Expenses page (see related documentation for details).
Understanding Job Profitability with Quotes (Projected vs Actual)
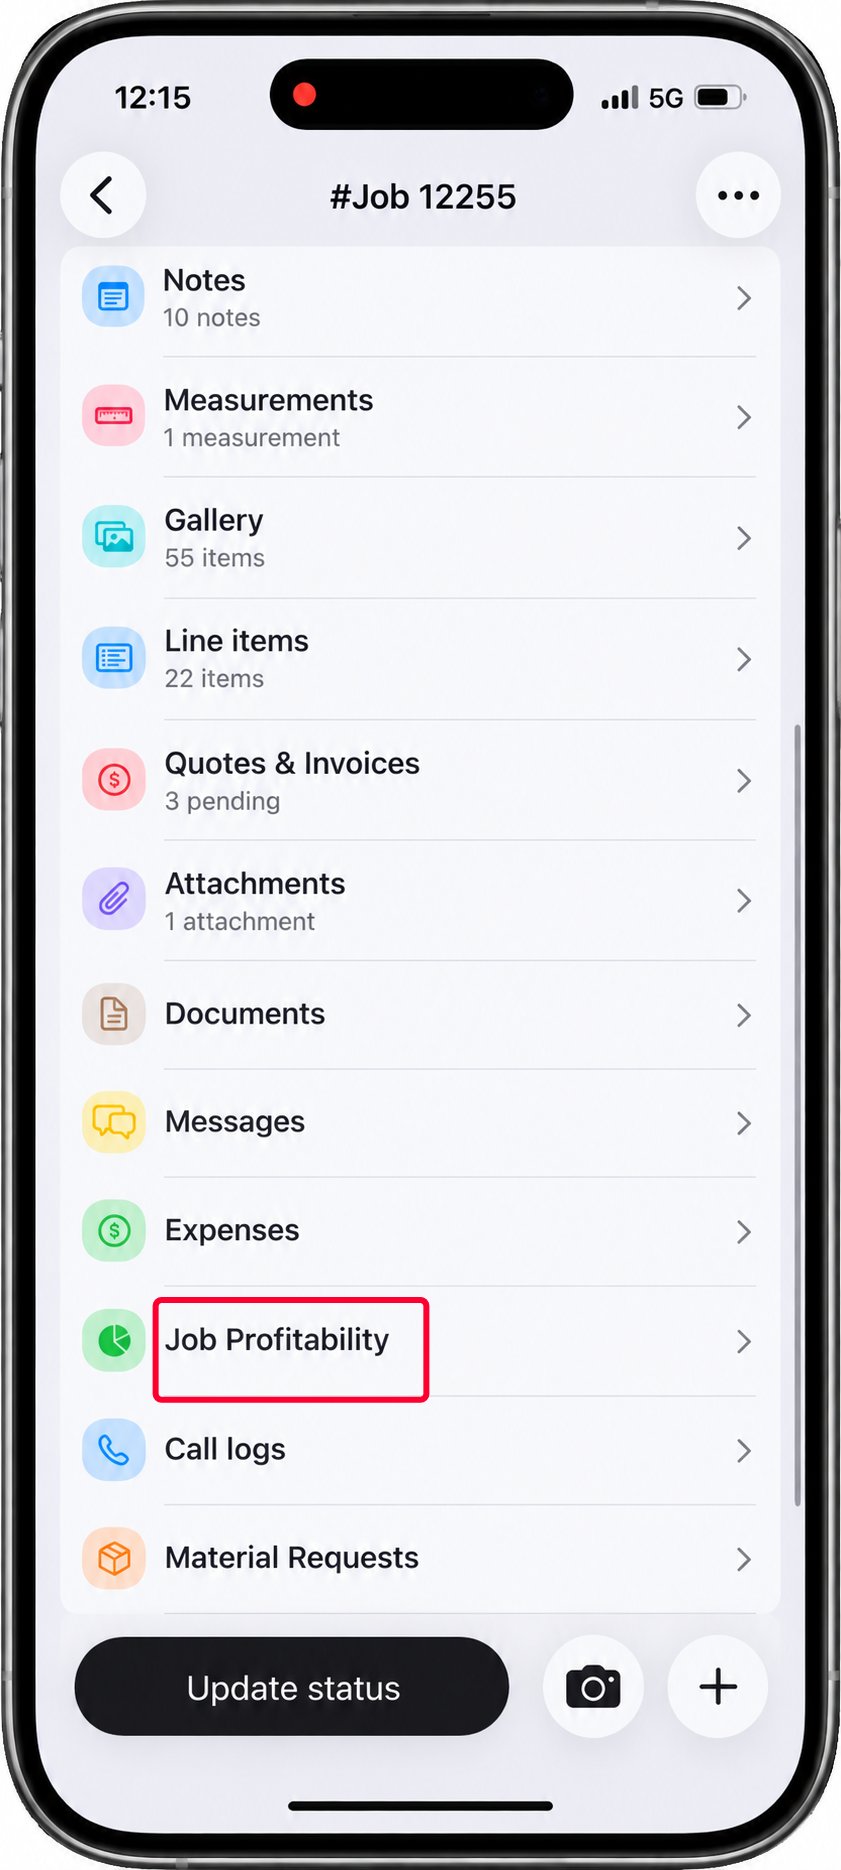
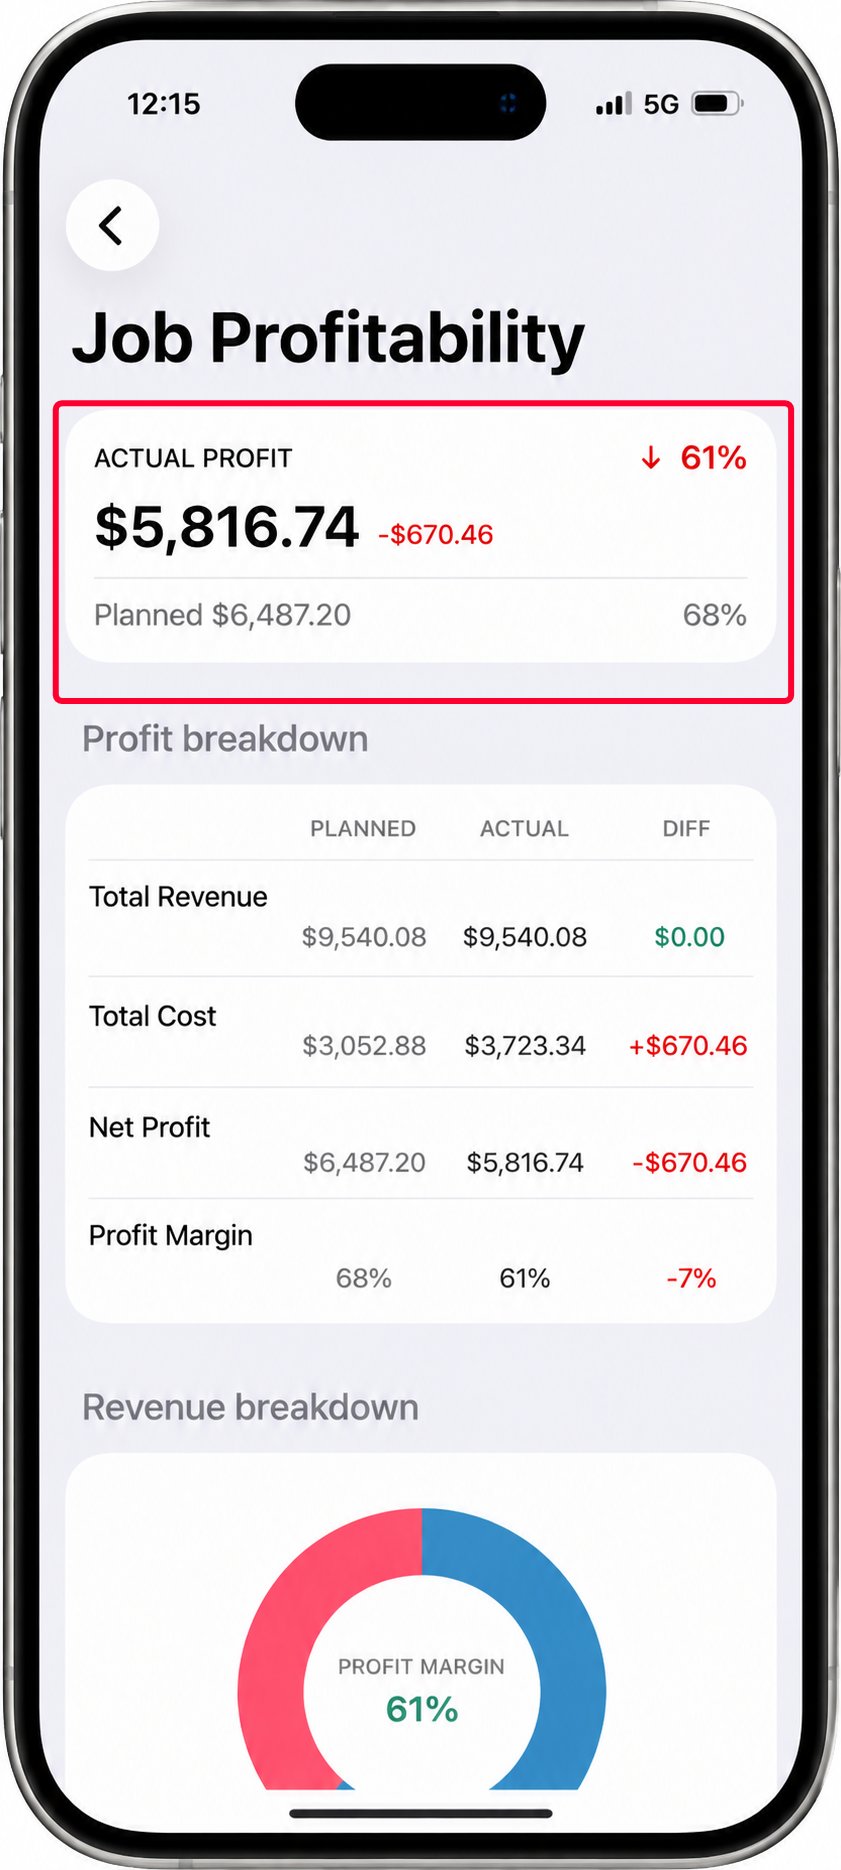
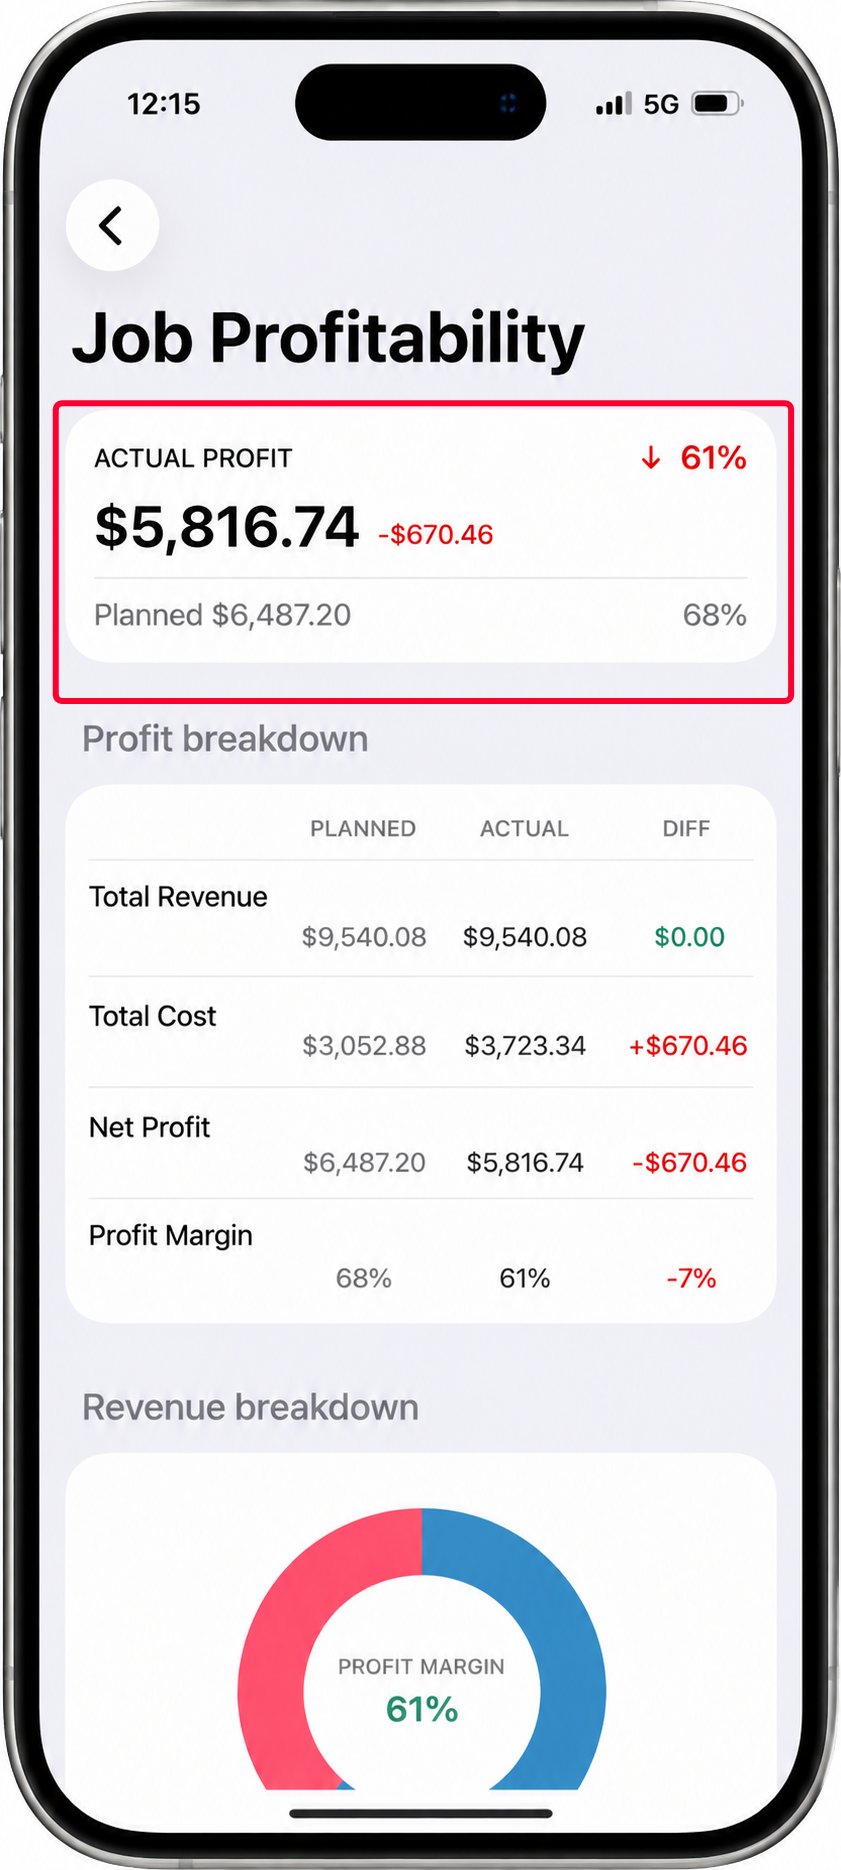
For roofing, Zuper provides an enhanced profitability view based on customer-accepted quotes. When the Sum of Accepted Quote Values Associated to the Job option is set in Settings, Zuper displays Projected and Actual profitability values on the Web, while the mobile app displays the corresponding values as Planned and Actual.- Web
- Mobile
On your Job Details page, the Line Items section includes details about the parts and services, labor, and expenses associated with the job. These values contribute to the job’s profitability calculation.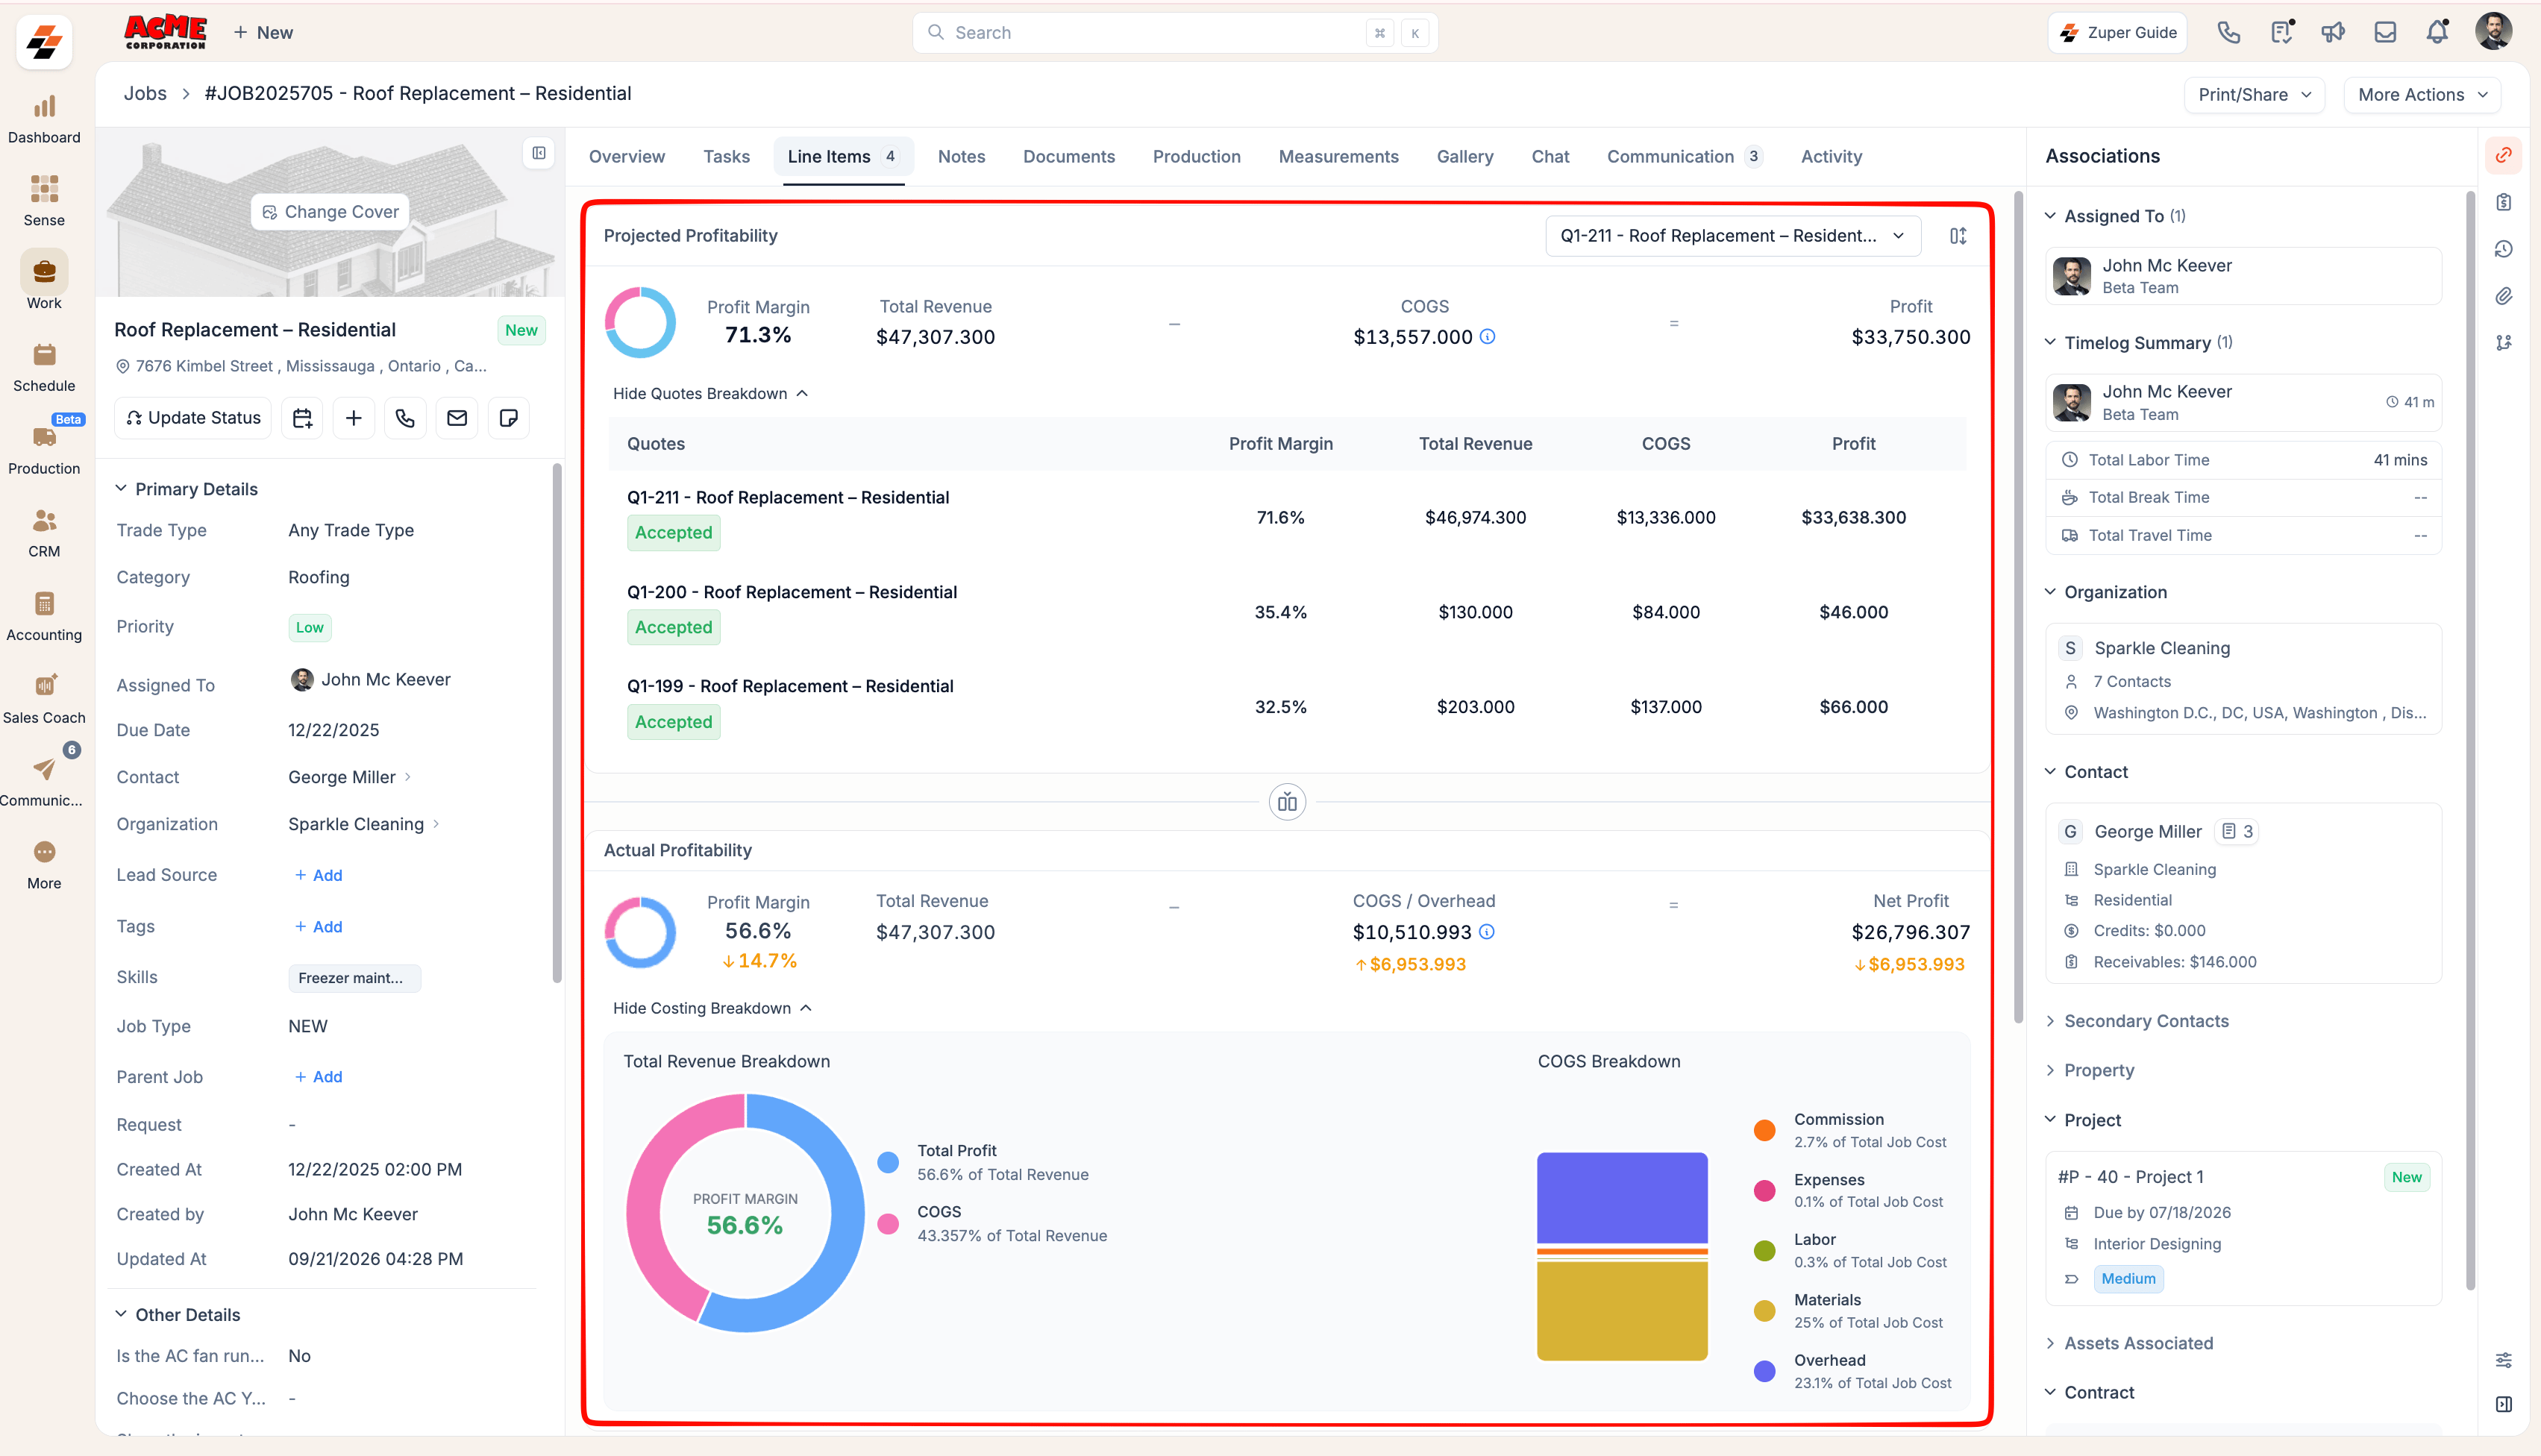
- Projected profitability represents the expected margin based on the revenue and estimated costs defined in the quote.
- Actual profitability shows the financial outcome of the job after execution based on the actual costs recorded, including labor, materials, expenses, and commissions. The revenue used for this calculation is based on the sum of accepted quotes, aligning profitability with the customer-committed price. Any difference from projected profitability reflects cost overruns or savings during execution.
Important: When multiple quotes are linked to a job, accepted quotes are given the highest priority. If no quotes are accepted, sent quotes are considered next, followed by draft quotes. You can manually select or deselect quotes directly from here when needed. 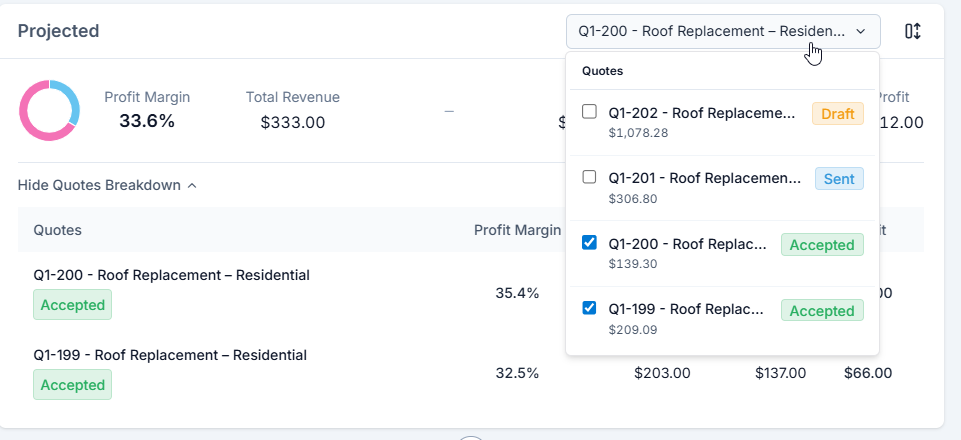
Comparing Job Profitability Values
Comparing projected/planned and actual profitability values helps your business identify patterns and gaps. By reviewing the differences, teams can take corrective actions, such as improving estimating accuracy, negotiating supplier pricing, or adjusting margins for future quotes.- Web
- Mobile
On the Web, you can review Projected Profitability and Actual Profitability separately. Each view displays the Profit Margin, Total Revenue, COGS, and Profit values, allowing you to compare the expected profitability with the actual financial outcome of the job.Projected ValuesProjected values represent what you expected to earn when the customer accepted the quote. These values come directly from the quotes associated with the job, and they act as the financial benchmark.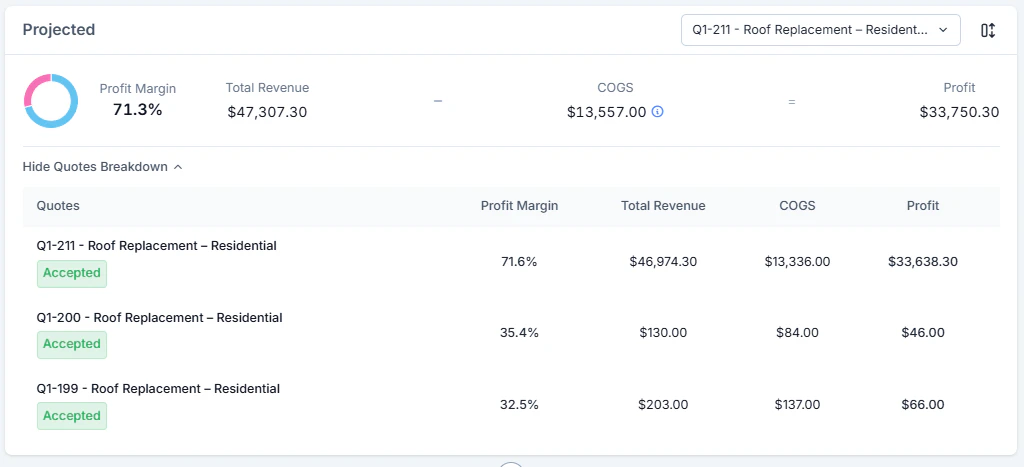
- Projected Total Revenue
This is the sum of accepted quote subtotals. Taxes are excluded because Zuper treats taxes as collected on behalf of the government. - Projected COGS
This includes the estimated cost of materials and service captured in the quote. - Projected Profit
This is calculated as projected revenue minus projected COGS. For example
If the accepted quote value is $333 and the estimated COGS is $221, the projected profit is $112 with a margin of 33.6 percent.
- Actual Total Revenue
Actual Total Revenue represents the revenue baseline used to calculate real-time profit and margin in the Actual view. It is derived from the sum of customer-accepted quote subtotals (excluding taxes), so profitability stays in line with the customer-committed price.
Note: When revenue is sourced from accepted quotes, changes made during job execution affect only Actual COGS. As a result, profit and margin are determined solely by cost increases or savings, and no revenue variance is reflected.
Unlocking Actual Total Revenue
Unlocking Actual Total Revenue
By default, Actual Total Revenue is locked to the sum of accepted quote subtotals. This ensures profitability is always measured against the customer’s committed price, even if job line items change during execution. In this locked mode, no revenue variance is shown; any cost overrun reduces profit, and any cost savings increase it, giving a clear view of execution efficiency and cost control.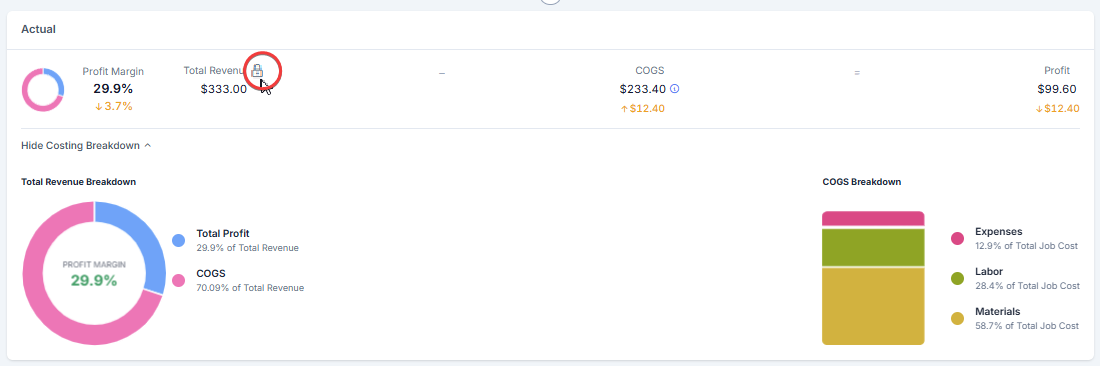
- Actual COGS/Overhead
This includes the actual costs and overhead associated with the job.
What is overhead?
What is overhead?
Overhead represents the indirect costs of running your business. Zuper applies the Overhead percentage configured in Job Costing Settings to the job’s total revenue and deducts the resulting amount from Gross Profit when calculating Net Profit.
Note: Admins can override the Overhead value for a specific job by clicking the Edit icon next to the Overhead percentage in the Financial Details panel.
- Actual Profit
Actual Profit is calculated by subtracting Actual COGS from the revenue baseline. For Example
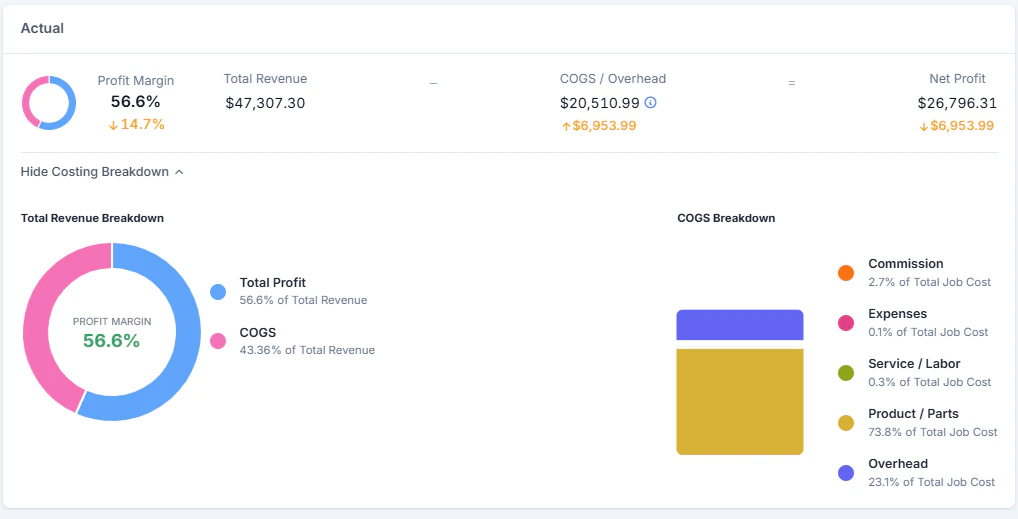
If actual costs increase, for example, if expenses rise by $30.00, Total COGS reaches $15,233.40, which is 32.2% of total revenue. After accounting for overhead ($4,730.73) and commissions ($546.86), the net profit is $26,796.31, and the actual margin settles at 56.6%, down from the projected 71.3%. Zuper highlights this variance with visual indicators so cost overruns are immediately visible.
Viewing Financial Details
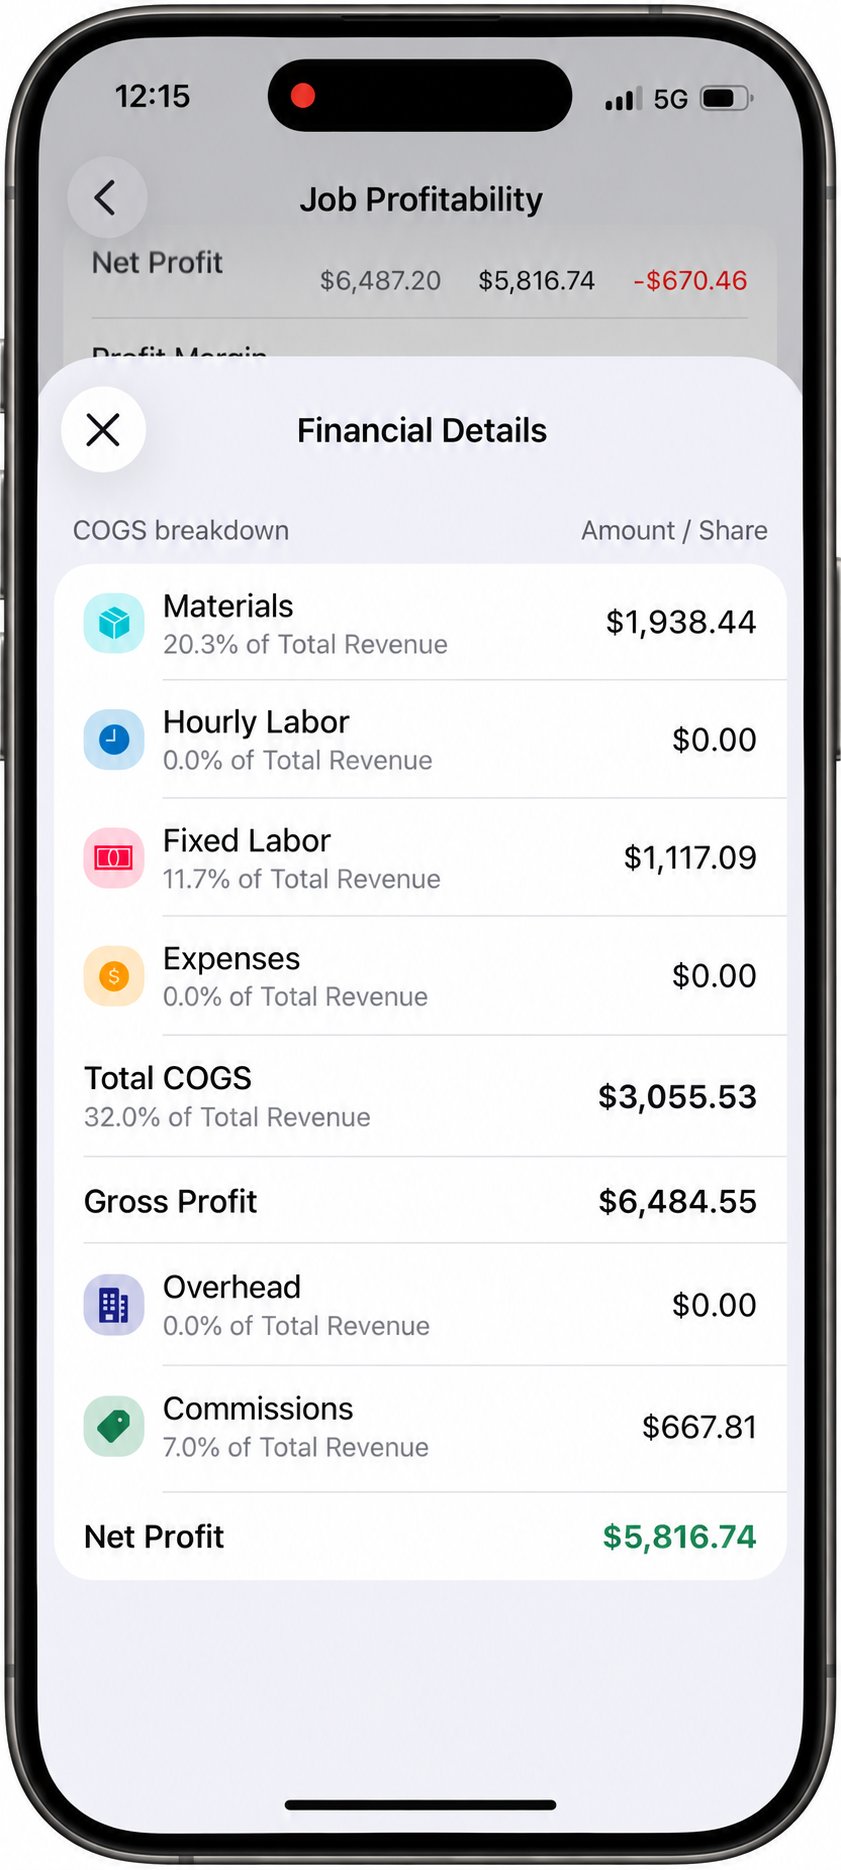
Financial Details provides a detailed view of the costs and profit that contribute to the job’s overall financial performance. It helps you understand how individual cost components affect the job’s profitability by showing both their amounts and contribution to the financial outcome.- Web
- Mobile
In the web app, hover over the COGS / Overhead value in the Actual Profitability section to open the Financial Details panel.The panel provides a complete profitability breakdown, including Material, Labor, and Expenses, which together make up Total COGS. It also displays Gross Profit, Overhead, Commission, and Net Profit, helping you understand how each cost and deduction contributes to the job’s final profitability.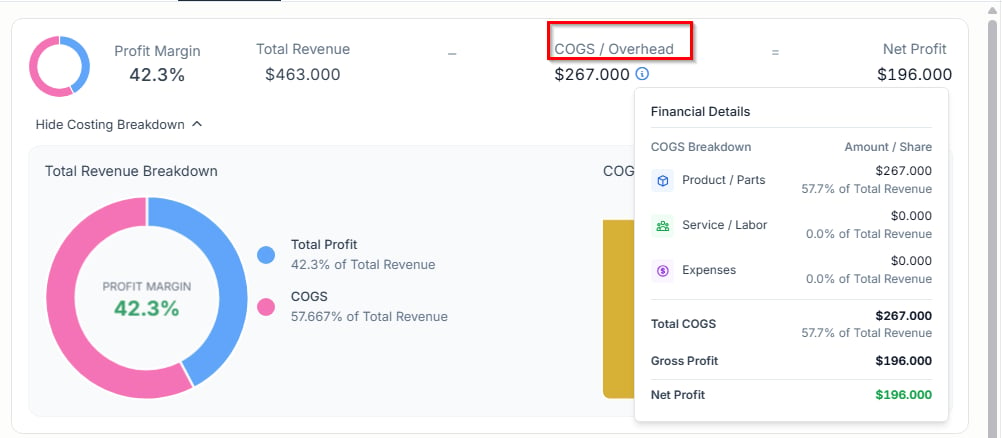
Review Revenue Breakdown
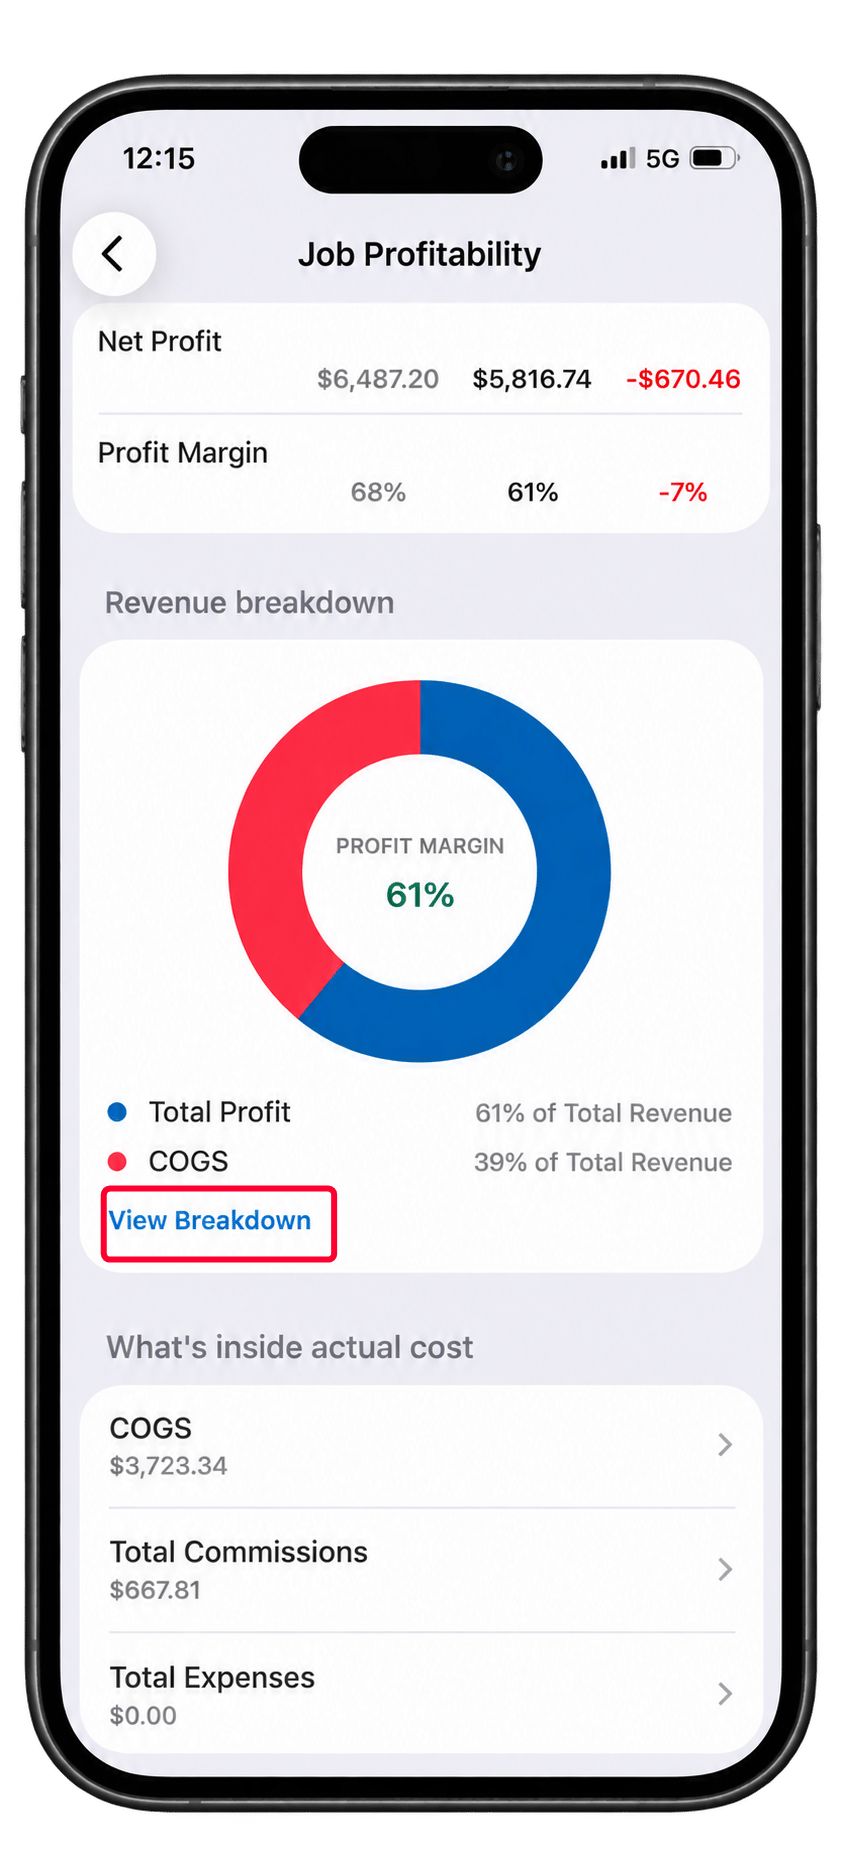
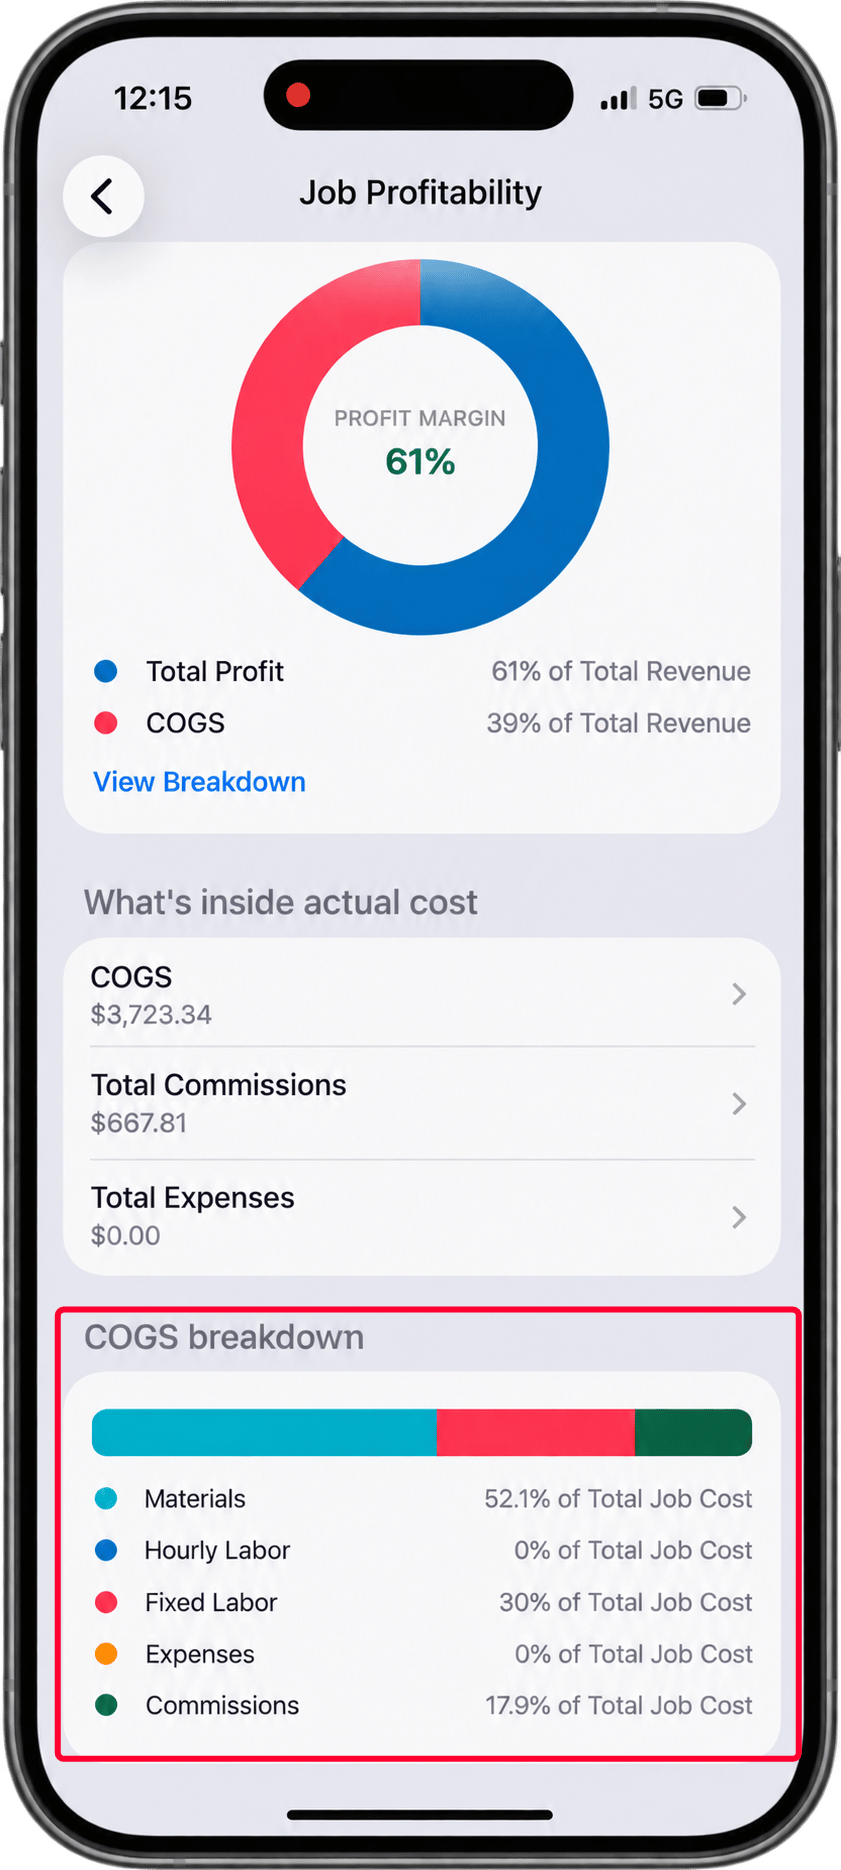
The Revenue breakdown shows how the job’s total revenue is distributed between Total Profit and COGS. This helps you understand how much of the revenue remains as profit and how much is used to cover the job’s costs. The breakdown is represented as a donut chart, with Profit Margin displayed at the center. The chart also shows:- Total Profit – Displays the percentage of Total Revenue represented by profit.
- COGS – Displays the percentage of Total Revenue represented by the cost of goods sold.
- Profit Margin – Displays the profit margin calculated from the job’s revenue and profit.
- Web
- Mobile
In the Web app, open the required job and navigate to the Actual Profitability section. Select View Costing Breakdown to open the breakdown view, where you can review the Total Revenue Breakdown and COGS Breakdown.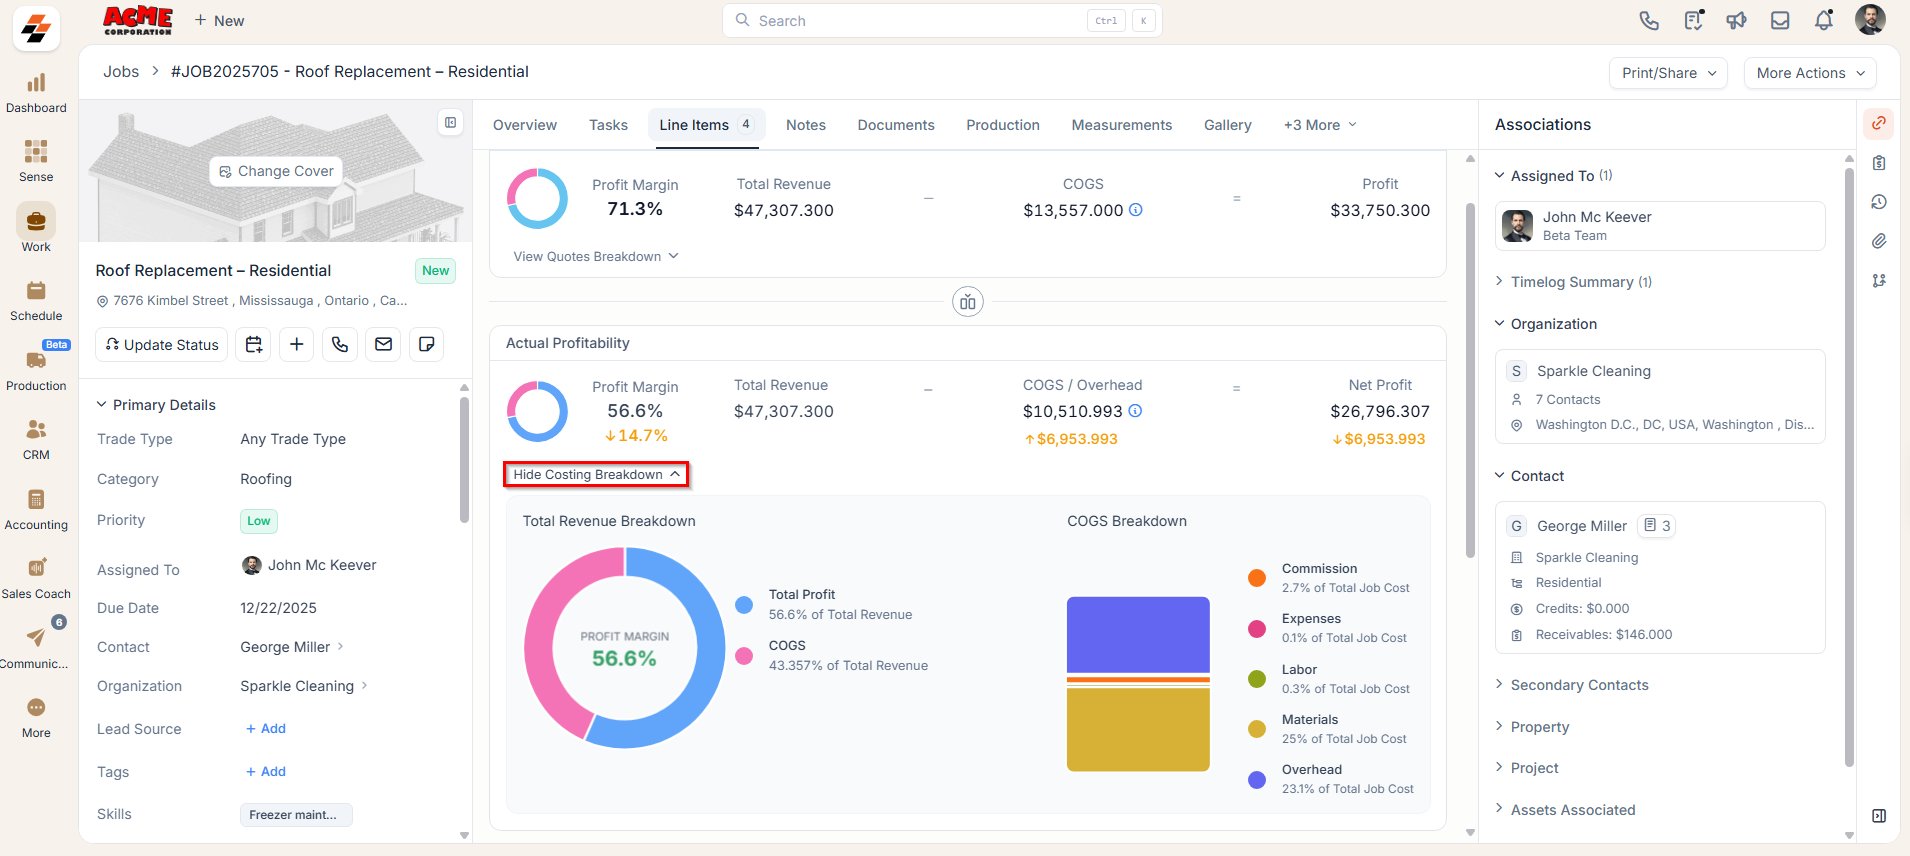
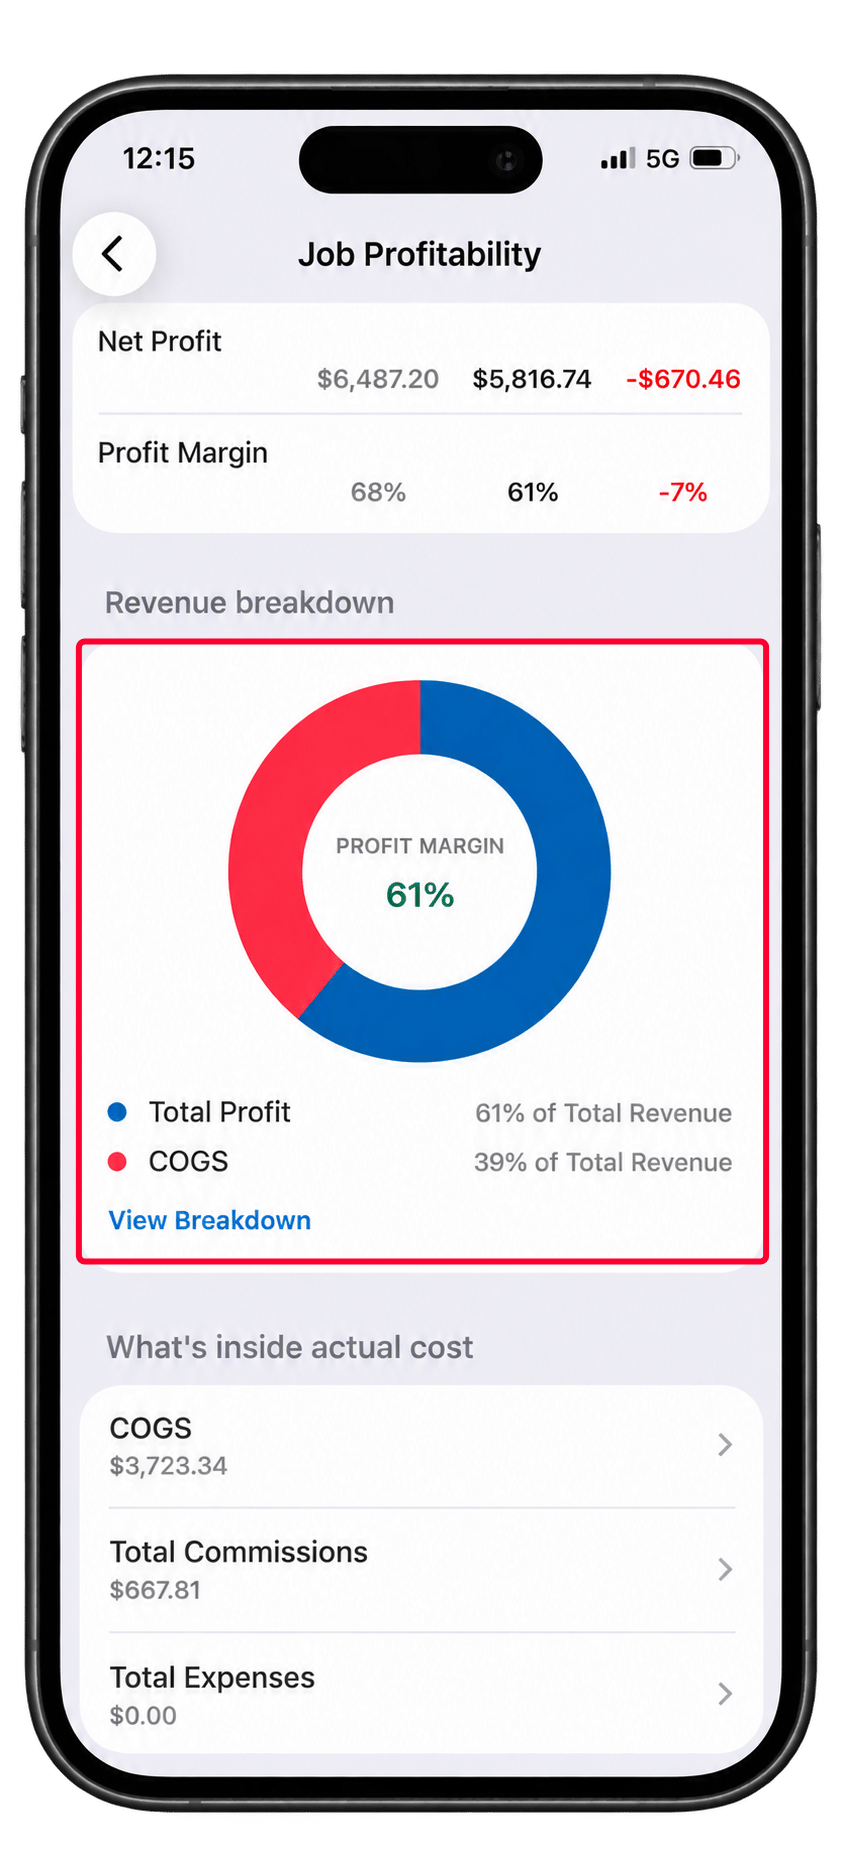
Review Actual Cost
Actual Cost represents the costs recorded for the job during execution. It helps you understand what the job actually cost to deliver and identify the cost components that contribute to the job’s final profitability.- Web
- Mobile
In the Web app, actual cost is represented through the Financial Details view. The view breaks down the costs contributing to the job’s financial performance, including Material, Labor, Expenses, Commission, and Overhead.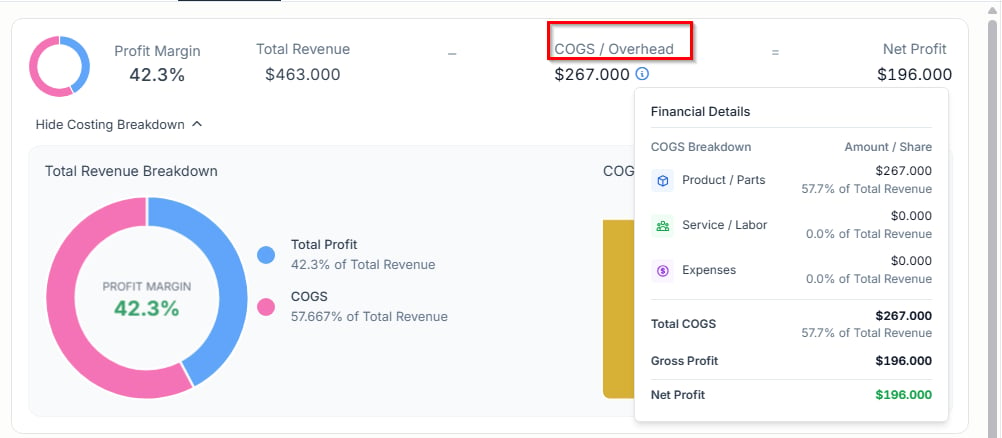
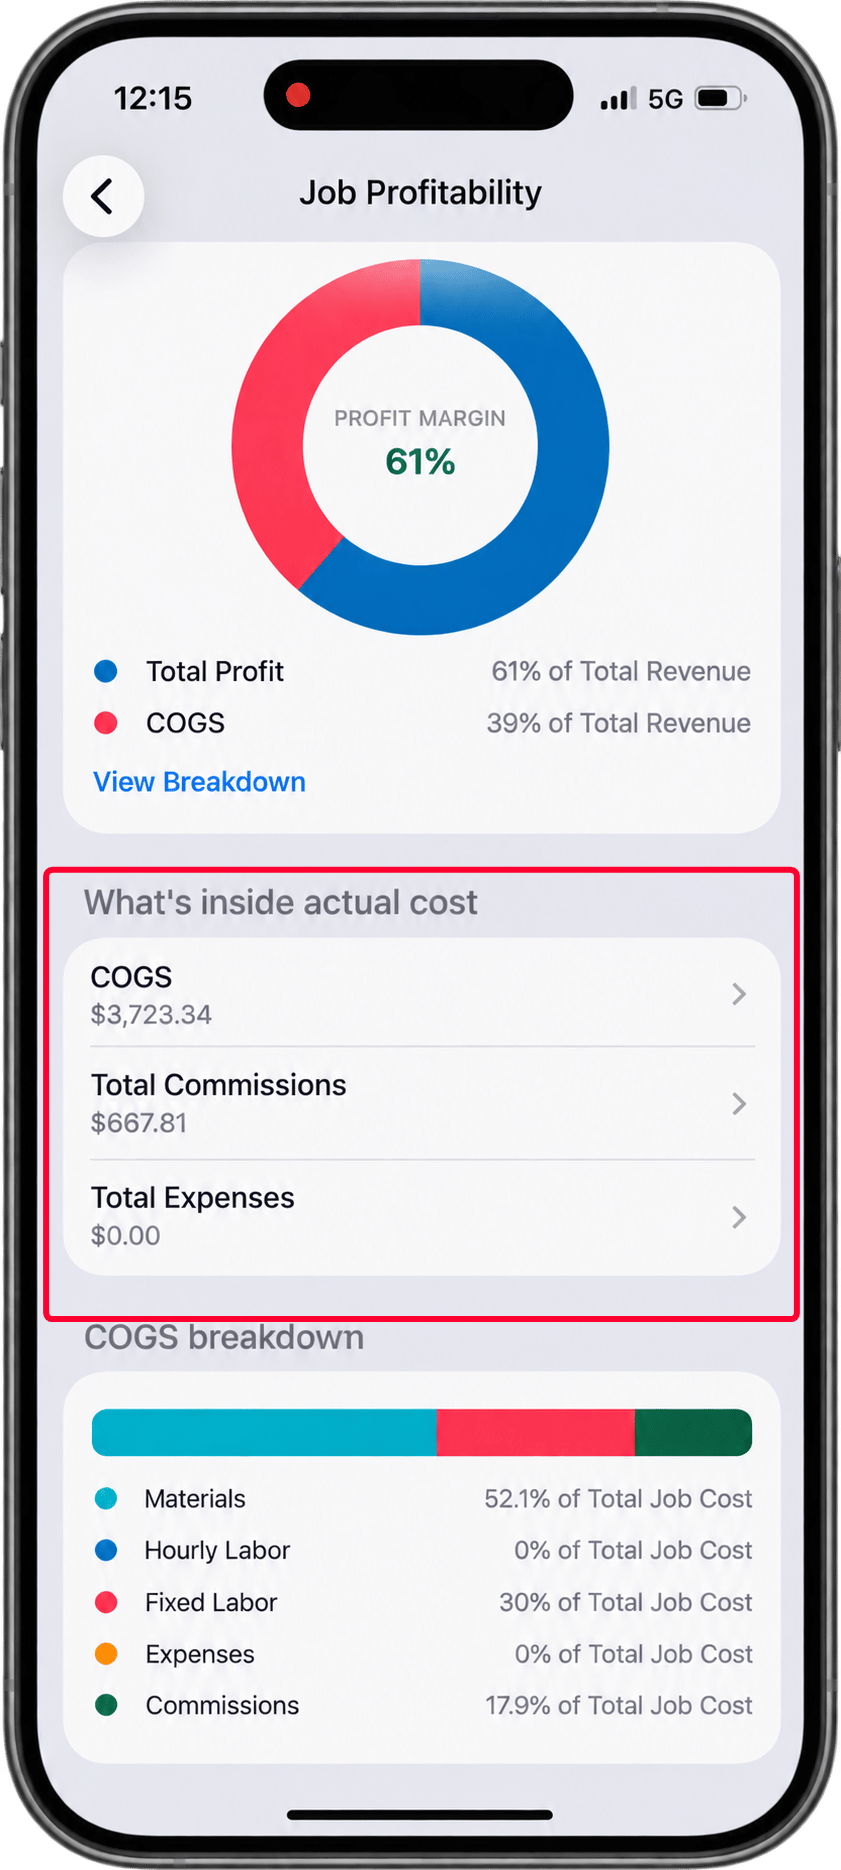
Review COGS Breakdown
Cost of Goods Sold (COGS) represents the direct costs associated with delivering the job. It helps you understand how much of the job’s revenue is consumed by the costs required to complete the work, providing visibility into the costs that affect the job’s profitability. The COGS Breakdown provides a visual representation of how each cost component contributes to the job’s Total Job Cost, including Materials, Labor, Expenses, Commission, and Overhead. Each category is represented by a different color, and the length of the corresponding bar indicates its share of the total cost.- Web
- Mobile
In the Web app, select View Costing Breakdown at the bottom of the Actual Profitability section to view the COGS Breakdown.You can review the contribution of: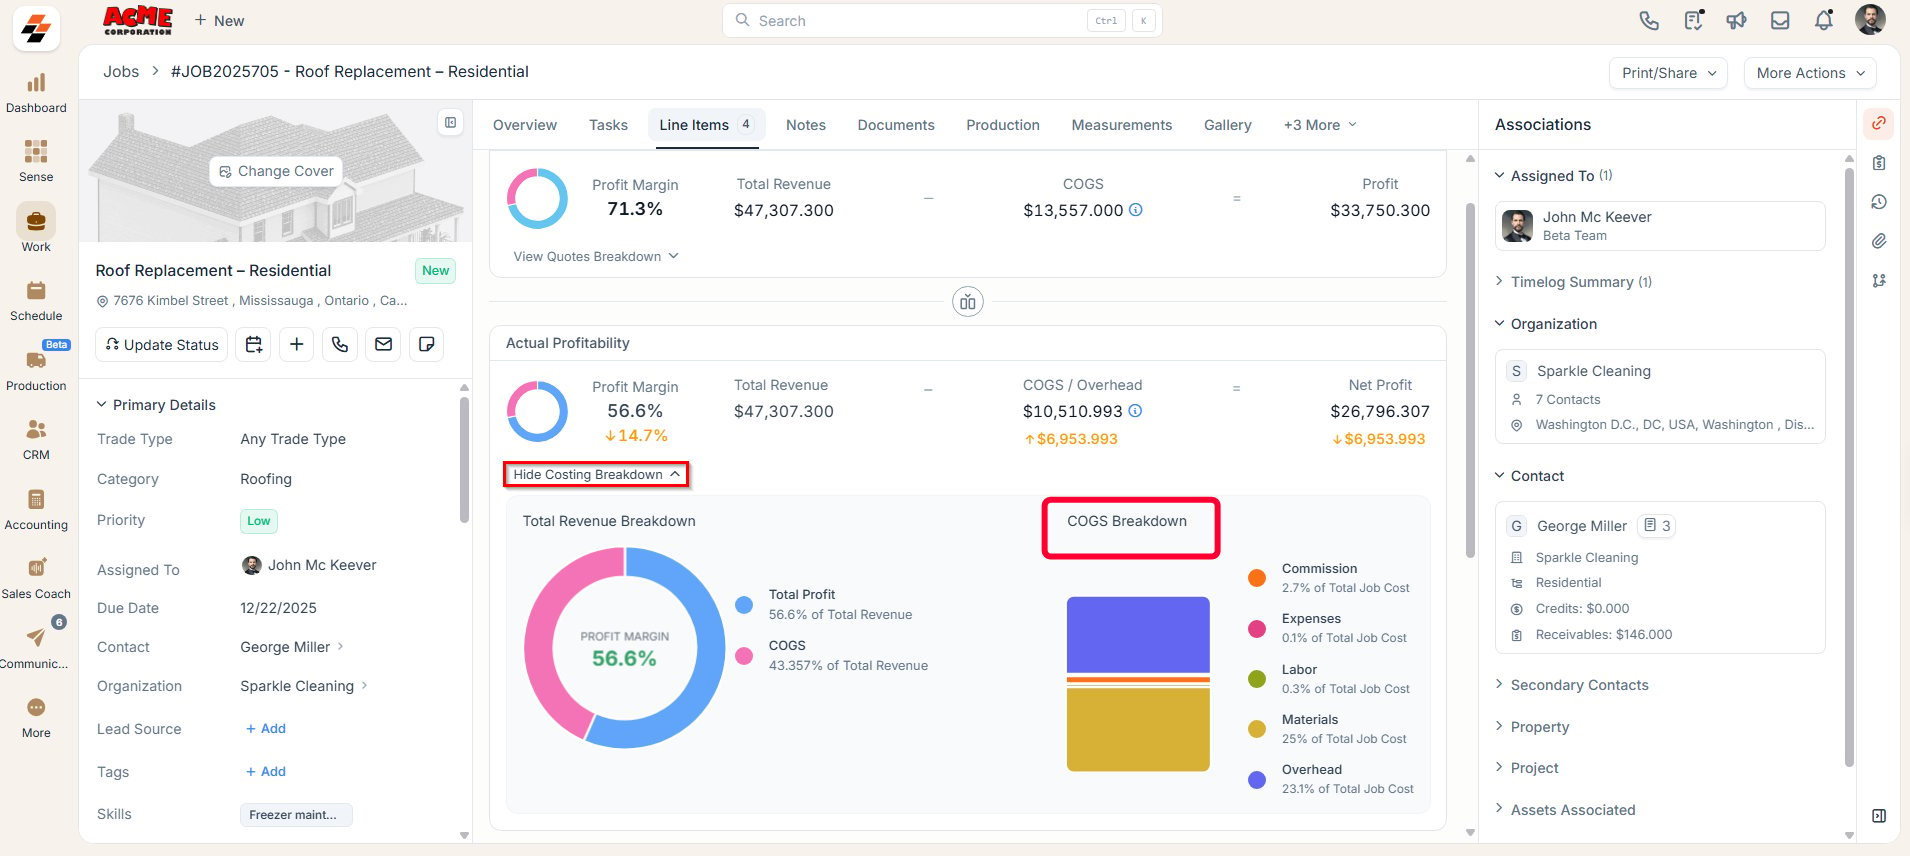
- Materials – Shows the share of material costs in the total job cost.
- Labor – Shows the share of labor costs in the total job cost.
- Expenses – Shows the share of applicable expenses.
- Commission – Shows the share of commission costs.
- Overhead – Shows the share of overhead costs.
Understanding Job Profitability with Job Line Items
When job profitability is calculated using job line items, revenue comes from the selling prices of parts, products, and services added to the job. These revenue and costs (COGS) are subtracted to show your gross profit and margin. As reps add materials such as shingles or underlayment, insert expenses, log labor hours, or add commission, Zuper continuously updates the total cost.